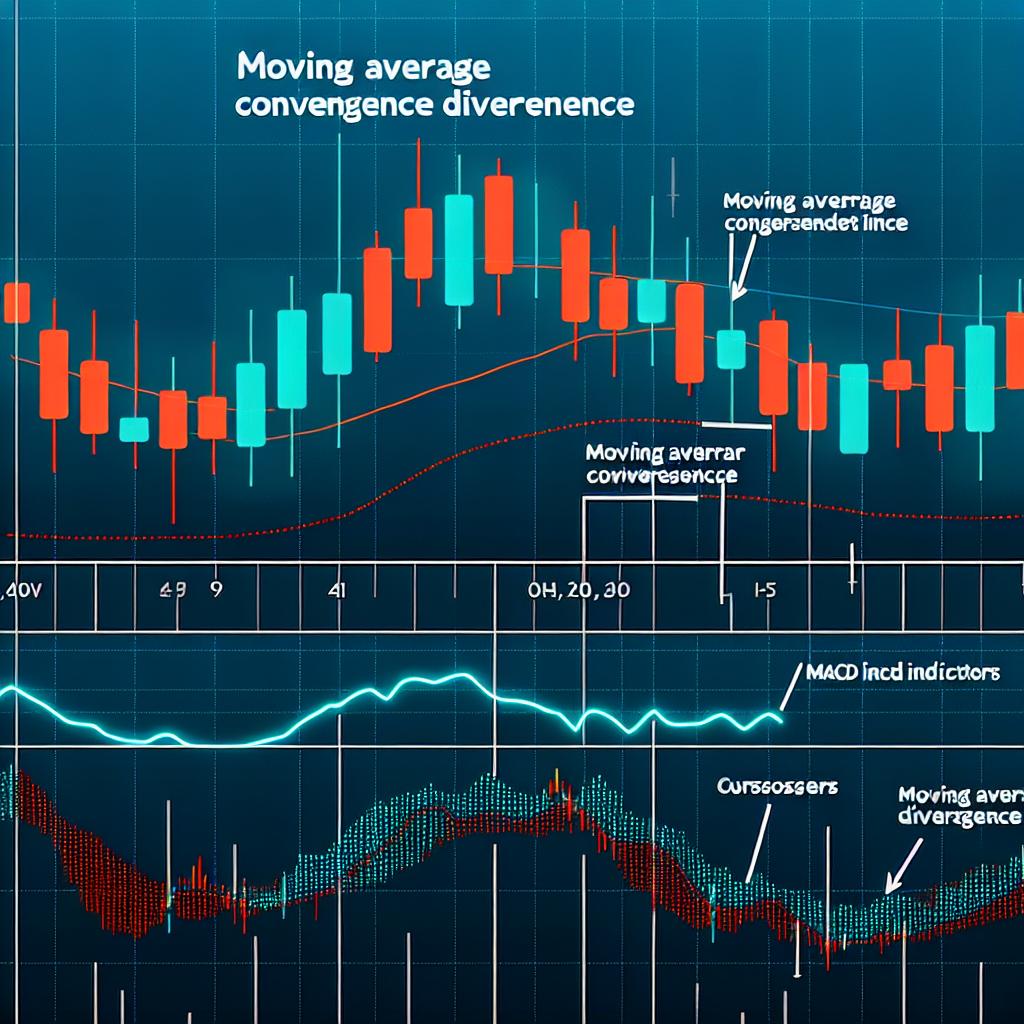
Understanding Multiple Time Frame Analysis in Forex Trading


Multiple Time Frame Analysis (MTFA) is an integral technique in the arsenal of Forex traders seeking to enhance their market understanding and trading efficacy. This method involves scrutinizing currency pairs over different timeframes, facilitating traders to make well-rounded decisions and refine their strategies. Through a structured look at varying temporal views, traders aim to fortify their market predictions and improve overall performance.
The Concept of Multiple Time Frame Analysis
Forex trading thrives on precise analysis and strategic foresight. Timeframes, therefore, are indispensable as they offer a chronological context of market behavior. MTFA delves into a singular currency pair, observed through multiple frames such as 1-hour, 4-hour, daily, weekly, and monthly charts. Each timeframe serves to identify trends of differing durations, allowing traders a consolidated perspective on market dynamics.
Why Use Multiple Time Frame Analysis?
Adopting MTFA in Forex trading comes with several notable advantages that cater to both novice and seasoned traders.
Enhanced Perspective: A multi-angle observation of the market allows traders to discern any conflicting signals that may arise. By not relying on a singular timeframe, traders mitigate the risks associated with one-dimensional analysis, establishing a more cohesive insight into price movements.
Improved Entry and Exit Points: Short-term charts provide the granular detail necessary to identify optimal points to enter or exit trades. Meanwhile, longer-term charts furnish a confirmation on the trajectory of trends. This dual approach aligns tactical trade entries and exits with the broader movement tendencies.
Better Risk Management: Understanding trends through multiple lenses not only aids in recognizing the dominant trend but also in aligning trading actions with it. This alignment is crucial in devising risk management strategies that limit exposure to reversals that contradict the prevailing trend of the broader timeframe.
Steps to Conduct Multiple Time Frame Analysis
The execution of MTFA, while varied in technique, generally adheres to several essential steps:
1. Identifying the Long-Term Trend: The process begins with a macroscopic view via higher timeframe charts like the daily or weekly. This initial step sets the stage by illuminating the primary trend direction, providing an overarching sentiment of the market stance.
2. Evaluating the Medium-Term Trend: Transitioning to an intermediate analysis, traders utilize a 4-hour chart to identify market corrections and potential reversal zones. This medium-term perspective is crucial in understanding intermediate fluctuations that may influence entry timing.
3. Confirming with the Short-Term Trend: The final scrutiny occurs through the lens of a lower timeframe such as the 1-hour chart. This level of detail facilitates the pinpointing of exact entry and exit placements, ensuring tactical alignment with the observed overarching trend.
Practical Application of Multiple Time Frame Analysis
Consider a practical example of a Forex trader observing the EUR/USD currency pair:
Long-Term View: The weekly chart projects a sustained uptrend, indicating bullish market conditions.
Medium-Term Perspective: Upon examining the 4-hour chart, the trader identifies a retracement within this uptrend. The presence of this retracement could signal a period of consolidation or a precursor to a continuation of the long-term trend.
Short-Term Execution: A further zoom into the 1-hour chart reveals a bullish reversal pattern. Such a pattern aligns suggestively with the longer-term uptrend, offering a favorable entry point for a long position.
The integration of these varying perspectives exemplifies the analytical depth that MTFA brings to Forex trading, allowing traders to act within a framework supported by multi-layered evidence.
For those aspiring to deepen their strategic prowess in Forex trading, platforms dedicated to Forex education and strategies, such as BabyPips, offer a wealth of resources to enrich your learning journey.
Conclusion
Multiple Time Frame Analysis stands as a vital component in the toolkit of Forex traders, enabling a holistic comprehension of market landscapes. By engaging with MTFA, traders advance their abilities in trend identification and trade execution proficiency. This methodology not only hones decision-making but also has the potential to enhance profitability. The key to mastering MTFA lies in persistent practice and the pursuit of continuous learning, as each trading situation presents its nuances requiring a nuanced approach. The application of MTFA equips traders with the discernment to navigate the volatile Forex market, aligning trades with nuanced insights derived from a composite view of temporal analyses.


