What lot size means in forex

What lot size means in forex

Understanding Lot Size in Forex Trading

In the world of forex trading, a term that frequently arises is lot size. It is an essential concept that traders must understand to engage effectively in the forex market. Lot size denotes the quantity of a currency that is being traded in the marketplace. Forex transactions are typically carried out in specific volumes of currency units, which makes understanding lot size crucial for anyone looking to invest or trade in this financial arena.

Types of Lot Sizes

The forex market uses a standard unit of measure called a lot to express trade sizes. There are different types of lot sizes employed in forex trading, each with its distinct characteristics and implications, allowing traders to select one that best suits their trading strategies and risk management plans.

Standard Lot

A standard lot is the equivalent of 100,000 units of the base currency in a forex trade. When you buy or sell a standard lot, you are essentially trading 100,000 units of the base currency, which can result in significant profits or losses, depending on market movements. Given its size, trading in standard lots is typically more suitable for experienced traders who have substantial capital and the capacity to endure potentially high levels of risk.

Mini Lot

For those who are less experienced or wish to take on less risk, trading in mini lots is a common practice. A mini lot represents 10,000 units of the base currency. This smaller lot size reduces potential risk exposure, making it popular among new traders or those with a smaller capital base. Trading with mini lots allows traders to gain more control over their positions and gradually build their expertise without being exposed to the full magnitude of risks associated with standard lots.

Micro Lot

An even smaller option is the micro lot, representing 1,000 units of the base currency. Trading micro lots allows for greater flexibility and risk management, enabling traders to start with a minimal investment. For those who wish to test different trading strategies or get acquainted with dynamic markets without considerable financial commitment, micro lots present an appealing option. Additionally, they provide a lower risk approach for fine-tuning trading skills and adjusting strategies.

Importance of Lot Size Selection

Choosing the right lot size is crucial in managing risk and defining trading strategies. The lot size you select affects the value per pip movement, which in turn impacts potential profit or loss. Larger lot sizes mean that each pip movement results in more significant financial changes, while smaller lot sizes dampen these effects.

For example, a one pip change in a standard lot is typically worth $10, whereas in a mini lot, it is worth $1, and only $0.10 in a micro lot. This variance implies that understanding and selecting the appropriate lot size are pivotal to balancing risk exposure and achieving strategic goals in trading.

Risk Management

Effective risk management is at the core of forex trading, and choosing an appropriate lot size is an integral part of this process. Traders must assess their risk tolerance—the degree of variability in investment returns that they are willing to withstand. For example, advanced traders with higher risk tolerance might opt for standard lots to amplify potential returns, while risk-averse traders might choose mini or micro lots to limit exposure.

Capital Availability

Capital availability also significantly influences lot size decisions. Traders with substantial capital reserves may comfortably engage in larger lot sizes, gaining the ability to endure more significant market fluctuations. Conversely, those with limited capital might gravitate towards smaller lot sizes to preserve equity over prolonged periods of trading.

Strategy Alignment

Each trading strategy may require different lot sizes to optimize performance. Scalping strategies, characterized by frequent small trades, often benefit from the use of smaller lot sizes to maximize the number of positions. Meanwhile, long-term strategies relying on extensive market analysis might employ larger lot sizes to capitalize on significant market trends.

Ultimately, it is essential for traders to harmonize their lot size decision with their overarching trading plan, honing their approach to suit their particular goals and market conditions.

Conclusion

Understanding and choosing the appropriate lot size is a fundamental aspect of successful forex trading. Regardless of the level of experience, traders should thoroughly assess their individual financial goals and risk appetite when determining the lot size that best suits their trading strategy. A well-considered lot size can optimize market performance, align with strategic intentions, and keep risk exposure within manageable boundaries.

For further detailed information on forex trading concepts, consider exploring comprehensive resources or tutorials on reputable financial education platforms. By deepening your knowledge and staying informed, you can enhance your ability to navigate the complexities of forex trading and make well-informed decisions that drive success in this dynamic financial landscape.

What a pip means in forex trading

What a pip means in forex trading

The Role of Pips in Forex Trading

A fundamental aspect of engaging in forex trading is understanding the terminology that governs this vast market. Among these terms, “pip” stands out as a crucial concept that every trader, both novice and experienced, needs to be well-acquainted with. Essentially, a pip quantifies the difference in value between two currencies in a trading pair. While this may seem straightforward, the function and calculation of pips have a notable impact on trading outcomes and strategies.

Unpacking the Concept of a Pip

The term pip, short for “percentage in point” or “price interest point,” serves as the smallest possible price movement for a currency pair in the forex market, as dictated by market standards. Generally, for most currency pairs, a pip equals 0.0001. Therefore, if the EUR/USD currency pair transitions from 1.1200 to 1.1201, this reflects a movement of one pip. Currency pairs involving the Japanese yen are an exception, where a pip usually corresponds to a 0.01 change. This deviation arises due to the relatively lower value of the yen compared to most other prominent currencies.

The Criticality of Pips in Forex Trading

Grasping the concept of pips is imperative for multiple reasons that are pivotal to forex trading endeavors.

Calculating Profits and Losses: Pips form the bedrock of calculating potential profits and losses. With currency values often denoted using five significant figures, even minute price shifts can culminate in substantial financial impact, particularly when handling significant trade volumes. This underscores the need for traders to vigilantly monitor pip fluctuations and align them with their risk management strategies.

Standardizing Trade Sizes: Pips offer a standardized measurement tool across myriad currencies. This uniform standard ensures that irrespective of the currency pair being traded, traders have a consistent metric to gauge and compare trade sizes, facilitating a clearer understanding of market dynamics.

Illustrative Pip Calculations

Consider a practical example involving the EUR/USD currency pair to better elucidate pip computations. Suppose a trader acquires this pair at the rate of 1.1150 and subsequently chooses to sell it when the rate escalates to 1.1165. This shift denotes a movement of 15 pips. Similarly, if one is engaged in trading the USD/JPY pair and witnesses a rate adjustment from 110.60 to 110.80, this represents a movement of 20 pips. Such straightforward calculations are fundamental for analyzing market movements and strategizing accordingly.

Elements Influencing Pip Value

The monetary worth of a pip is not static and can vary significantly based on several factors intrinsic to forex trading:

Currency Pair: The particular currency pair being traded impacts the pip value. Given the varied economic scales and volatilities of different currencies, the pip value is inherently pair-specific.

Trade Size: The volume or size of a specific trade proportionally determines the pip value. Larger trades naturally equate to an increased pip value, amplifying potential gains or losses.

Exchange Rate: The prevailing exchange rate between the two currencies in a pair also plays a pivotal role in governing pip value. Fluctuations in exchange rates necessitate real-time monitoring for accurate trade valuations.

For thorough and precise pip value determinations, traders often rely on digital resources like online pip calculators, which provide tailored computations, adapting to the intricacies of individual trades.

Interplay of Currency Market Dynamics

In forex trading, pips significantly extend beyond the simplistic profit-loss dichotomy; they mirror the volatility and liquidity prevalent within currency markets. Forex markets are inherently volatile due to the confluence of numerous factors such as economic indicators, geopolitical events, and sudden market demands. Consequently, shifts in pip movements underscore the volatility, demanding that traders maintain vigilance and adaptability in response to rapidly changing market landscapes.

To summarize, comprehending the essence and operational mechanics of pips in forex trading is indispensable for anyone venturing into this vibrant and intricate domain. By acquiring a profound understanding of pips, traders are better positioned to craft informed decisions, thereby enhancing their overarching trading strategies and optimizing their market performance.

Through conscious practice and awareness of pip-related movements and calculations, traders set themselves up for a potentially rewarding journey through the complex realm of forex trading. In essence, the comprehensive knowledge of pips facilitates robust risk management, strategic trade analysis, and ultimately, a firmer grasp of forex market dynamics, constituting a cornerstone for long-term trading success.

Major pairs minor pairs and exotic pairs explained

Major pairs minor pairs and exotic pairs explained

Understanding Major, Minor, and Exotic Currency Pairs

In the dynamic realm of foreign exchange, or Forex trading, understanding the classification of currency pairs into major, minor, and exotic categories forms a fundamental part of a trader’s knowledge. Recognizing these categories and their significance can profoundly influence trading strategies and impact profitability. This detailed exposition aims to illuminate the characteristics and implications of each type of currency pair, aiding traders in making informed decisions in the complex Forex market environment.

Major Currency Pairs

At the forefront of Forex trading lie the major currency pairs, known for their formidable position in the marketplace. Major pairs are predominantly characterized by their high liquidity and tight spreads, marking them as prime candidates for traders focused on stability and cost-efficient trading. These currency pairs consist of the US Dollar (USD) paired with the currencies of some of the world’s most robust economies, including the Euro (EUR), Japanese Yen (JPY), British Pound (GBP), Swiss Franc (CHF), Canadian Dollar (CAD), Australian Dollar (AUD), and New Zealand Dollar (NZD). Notable examples of major pairs include EUR/USD, USD/JPY, and GBP/USD.

Characteristics of Major Pairs

The defining characteristics of major currency pairs include:

High liquidity: The presence of numerous buyers and sellers ensures that transactions are completed swiftly and efficiently.

Lower spreads: Transaction costs are typically reduced due to the frequency and volume of trades.

Tight spreads: There is minimal discrepancy between bid and ask prices, facilitating cost-effective trading.

Due to their significant trading volume, major pairs exhibit lower volatility levels, rendering them particularly attractive to traders who prioritize stability and reduced market risk. Traders often favor these pairs due to their predictable nature, leveraging their stability to build robust trading strategies.

Minor Currency Pairs

In contrast to their major counterparts, minor currency pairs are distinguished by the absence of the US Dollar (USD) in the pairing. These pairs instead consist of other major world currencies and offer a distinctive trading avenue, albeit with increased spreads due to reduced trading volume. Exemplified by combinations such as EUR/GBP, EUR/AUD, and GBP/JPY, minor pairs still present ample opportunity for engaging in strategic trades because of their moderate liquidity.

Characteristics of Minor Pairs

Minor currency pairs possess the following core attributes:

Moderate liquidity: Despite not matching the volume of major pairs, liquidity remains substantial, allowing for active trading.

Higher spreads: Trading costs can be elevated, a natural consequence of diminished market activity compared to major pairs.

Great for diversification: These pairs are instrumental for traders seeking to diversify their holdings by reducing reliance on the USD.

The relative scarcity of USD in these pairs naturally causes a decrease in traded volume, resulting in higher trading costs. Nonetheless, minor pairs are instrumental in diversification strategies, offering traders opportunities outside the USD-centric focus prevalent in the market.

Exotic Currency Pairs

Exotic currency pairs inhabit a niche yet fascinating sector of the Forex market, comprising a major currency paired with one from a developing economy. Examples like USD/TRY (Turkish Lira), USD/SEK (Swedish Krona), and USD/ZAR (South African Rand) typify exotic pairs. These pairs are characterized by pronounced volatility and low liquidity, offering potential rewards for traders who can skillfully navigate their inherent risks.

Characteristics of Exotic Pairs

Exotic currency pairs are marked by distinctive traits:

Low liquidity: Limited trading activity confines the speed and immediacy with which trades can be executed.

High volatility: These pairs experience significant price fluctuations, presenting opportunities for substantial gains or losses.

Wider spreads: The elevated transaction costs reflect the decreased frequency of trades and elevated market risks.

The allure of exotic pairs lies in their potential for considerable price swings, which can attract traders seeking to exploit volatility for potential profits. However, the higher spreads and liquidity challenges demand a comprehensive understanding and shrewd management strategies.

Conclusion

A comprehensive understanding of different currency pairs—major, minor, and exotic—is essential for any Forex trader aiming to maximize success in the Forex market. Each category presents unique attributes and necessitates tailored trading strategies. Major pairs, marked by high liquidity and minimal spreads, are favored for their stability and efficiency. Minor pairs, less traded yet significant for diversification, enable traders to explore avenues outside USD dependency. Finally, exotic pairs, with their high volatility and potential for dynamic pricing shifts, offer prospects for notable gains provided risks are suitably managed.

For a comprehensive grasp of Forex trading and strategy development, traders are encouraged to delve into specialized trading forums and financial news sources. Engaging with reputable online finance courses can also enhance understanding, equipping traders to skillfully navigate this complex yet rewarding market.

How currency pairs are quoted in forex

How currency pairs are quoted in forex

Understanding Currency Pairs in the Forex Market

The forex market is global and a bit unforgiving: when you trade currencies, you’re not buying “money” in the usual sense. You’re making a bet on how one currency will value relative to another. That’s why forex trading is built around currency pairs. If you don’t understand the mechanics of those pairs—what the quote means, how bid/ask works, and why majors behave differently than exotics—everything else (charts, indicators, strategies) will feel like you’re trying to read a map while sprinting.

This guide expands on the core concepts behind currency pairs in forex. It’s written for people who already know the basics and want a clearer mental model before placing real money at risk. We’ll stay focused on the pair structure and the way prices are presented, then connect those ideas to how traders actually use them.

Currency Pairs: Why Forex Quotes Always Come in Pairs

Forex trades currencies in pairs because currency values move relative to each other. If the price of USD rises against EUR, that means one unit of USD buys more EUR than before. The market expresses that relationship directly through a pair.

A currency pair name usually follows this pattern: BASE/QUOTE. The slash matters because it defines what the number on your screen is actually measuring.

Base Currency and Quote Currency

Currency trading occurs with the pairing of two currencies, structured as a currency pair. Each pair comprises a base currency and a quote currency. The base currency is the first one listed, and the quote currency is the second. Take, for instance, the EUR/USD pair: here, the Euro (EUR) functions as the base currency, whereas the US Dollar (USD) acts as the quote currency.

What the Base Currency “Means” to the Trader

The base currency is the one you’re effectively buying or selling when you take a position. In an order ticket, your trade direction is tied to the base currency’s performance relative to the quote currency.

For example, with EUR/USD:

  • When you buy EUR/USD, you’re buying the base currency (EUR) and selling the quote currency (USD) at the current market rate.
  • When you sell EUR/USD, you’re selling EUR and buying USD.

That’s the whole game: positions are directional, but the market quotes the relationship as a price.

What the Quote Currency “Means” to the Trader

The quote currency is the measurement tool. It tells you what amount of the quote currency corresponds to one unit of the base currency.

So when the quote currency changes, the “value scale” changes too. That matters for volatility, price behavior, and even for how spreads feel across different pairs.

Interpreting Currency Quotes

When presented with a currency pair’s quote, such as EUR/USD = 1.2000, it suggests that one unit of the base currency (1 Euro) is equivalent to 1.2000 units of the quote currency (1.2000 US Dollars). This price demonstrates the amount of the quote currency required to purchase a single unit of the base currency.

It also tells you what happens when the pair moves:

  • If EUR/USD goes from 1.2000 to 1.2100, EUR is stronger relative to USD (or USD is weaker relative to EUR).
  • If EUR/USD goes from 1.2000 to 1.1900, EUR is weaker relative to USD.

Notice how everything is relative. The market doesn’t claim EUR “became better” in isolation; it simply reflects the change in the exchange rate between the two.

Common Confusion: “Which Currency Is Increasing?”

New traders often ask: “If EUR/USD increases, is EUR up or USD up?” The clean answer: in EUR/USD, when the pair increases, the base currency (EUR) is gaining vs the quote currency (USD). USD is effectively losing purchasing power against EUR.

This matters because many risk decisions depend on direction. A strategy that expects “USD to strengthen” should trade pairs where USD strengthening means the pair price moves in the expected direction.

How Bid and Ask Prices Work (and Why Spreads Are Not Just an Annoyance)

Every forex quote comes with two prices because the market has buyers and sellers. That pair quote isn’t one fixed number—it’s a small battle between demand and supply.

The Bid-Ask Spread

For each currency pair, there are two essential prices: the bid and the ask. The bid price is what the market or a broker is willing to pay to buy a specific currency pair from you. Conversely, the ask price represents what the market or broker expects to receive by selling the currency pair to you. The spread—the difference between the bid and ask prices—is a common gauge of the transaction costs involved in forex trading.

Buy at the Ask, Sell at the Bid

This is the part traders feel in their account even if they don’t talk about it much. When you:

  • Buy a pair, your entry price is typically the ask.
  • Sell a pair, your entry price is typically the bid.

Then your exit price depends on direction again. In other words, you don’t “start even” on day one unless the spread is zero (and in real life, it’s not).

Why Spreads Expand in Real Events

Spreads tend to widen when markets get jumpy: major economic releases, central bank announcements, sudden geopolitical headlines, or times of low liquidity (certain hours, holidays, etc.).

This doesn’t always mean the strategy is wrong, but it does change the cost structure. A method that targets a 10–15 pip move may suddenly struggle when spread jumps to a chunkier number. That’s not theoretical—it’s the sort of thing that shows up quickly when you trade through high-impact news.

How Spreads Differ by Pair

Major pairs usually have tighter spreads because they’re liquid and heavily traded. Exotic pairs often have wider spreads due to thinner liquidity and more uneven participation. You can think of liquidity like crowd size at an event: larger crowds generally move faster and price differences stay smaller. Smaller crowds mean more gaps and slower price action.

Direct and Indirect Quotes: The “Home Country” Detail

Currency quotes can be presented in different ways depending on where the quote is coming from and how the country traditionally expresses exchange rates.

Direct and Indirect Quotes

Currency quotes can further be categorized into direct or indirect, largely dependent on the trader’s home nation. A direct quote denotes the amount of domestic currency necessary to purchase one unit of a foreign currency. Meanwhile, an indirect quote reflects the quantity of foreign currency that can be acquired with one unit of domestic currency.

Why This Matters Less Than It Used To

In modern retail forex trading, most brokers present pairs in a standardized way around the familiar formats (EUR/USD, USD/JPY, etc.). That means you usually don’t have to manually convert from direct to indirect quotes just to trade.

Still, the concepts are useful. If you ever read an economics report from a country that writes quotes differently, the “number” might feel switched in your head. Understanding direct vs indirect quoting reduces that mental friction.

Types of Currency Pairs

Within forex, currency pairs are divided mainly into three categories. The category matters because each one tends to behave differently: spreads, volatility, and how sensitive the pair is to specific regional news.

Major Pairs

Major Pairs: These are the most traded currencies worldwide and frequently involve the US Dollar as either the base or quote currency, including combinations such as EUR/USD, USD/JPY, and GBP/USD.

Major pairs usually offer:

  • Lower spreads due to high liquidity
  • More dependable execution during usual market hours
  • More consistent reaction patterns to widely covered economic events

This is why they tend to be the starting point for many traders. It’s not because they’re “better,” but because trading costs and execution slippage are usually easier to manage.

Minor Pairs

Minor Pairs: Pairs in this category exclude the USD. They are typically formed from major currencies like EUR/GBP or AUD/CAD.

Minor pairs can have their own flavor. Since they don’t include USD, they may respond more strongly to factors specific to the two involved economies rather than the global USD story alone. For example, a European political announcement and a UK labor report can both matter—just not in the same way they would with EUR/USD.

Exotic Pairs

Exotic Pairs: This grouping involves a major currency paired with a currency from a smaller or emerging market economy, such as USD/SGD or EUR/TRY.

Exotics often bring:

  • Wider spreads (more cost each trade)
  • Higher volatility (bigger price swings)
  • Greater sensitivity to local political and economic developments

That last point is worth pausing on. A stable major-major pair might reflect broader global risk sentiment. An exotic pair can also reflect local central bank credibility, inflation expectations, capital controls, and political risk. You’re trading not only “currency,” but a whole set of country-specific conditions. Fun? Sometimes. Cheap? Usually not.

How Currency Pair Categories Show Up in Price Action

Here’s a practical way to think about it: pair categories influence liquidity, and liquidity influences how price moves.

When liquidity is high (majors), the market produces smoother transitions. When liquidity is lower (exotics), the price can jump more aggressively between levels, and sudden moves are more common around events.

This doesn’t automatically make exotics “bad.” It just means your strategy needs to respect the market you traded into. If your method assumes spreads stay tight and moves behave smoothly, exotics will punish that assumption.

Applying Currency Pair Concepts in Real Trading

To apply the foundational aspects of currency pairs effectively, traders must delve deeper into market dynamics and gain a practical understanding through practice and experimentation in a live environment. This involves utilizing demo accounts offered by various brokers before committing real funds, which can help in familiarizing oneself with the functionality of forex platforms, understanding transaction costs, and honing technical analysis skills.

What to Practice Specifically (So It Actually Helps)

Most beginners learn the idea of base and quote currency, then move on. But the profitable part is getting comfortable with execution details. You can practice these without risking capital:

  • Switch between buying and selling and confirm how it maps to charts (does the pair move “the way you expect”?)
  • Compare spread behavior across major vs exotic pairs during normal hours
  • Watch how the pip value and price scale feel different depending on the pair

Don’t rush. Demo accounts can hide some real-world slippage, but they still show you how quotes and spreads work in your broker’s environment.

A Small Real-World Example

Suppose you’re watching EUR/USD and you see it drop. You assume USD got stronger. Now you check USD/JPY and notice it’s rising too. That can happen because USD strength can pull multiple USD pairs in the same direction.

But if EUR/GBP is also falling while EUR/USD is falling, the message isn’t just “USD is strong.” It could be “EUR is weakening vs multiple counterparts.” Currency analysis often becomes clearer once you compare several pairs and understand their shared base or quote currency.

Key Considerations for New Forex Traders

For newcomers to the Forex market, understanding the differences between currency pairs is vital. Major pairs typically offer lower spreads, implying reduced transaction costs, which can be beneficial in volatile market conditions. Meanwhile, exotic pairs might entail higher spreads and be significantly influenced by geopolitical events from emerging markets, demanding more caution.

Additionally, assessing volatility is crucial; it requires understanding how much a currency pair’s price might move over a given period. Higher volatility can provide more opportunities for profits but also increases risk. Consequently, risk management strategies, such as setting stop losses, are paramount to safeguarding capital and maintaining sustainable trading practices.

Volatility: The “Speed of Change” You Need to Respect

Volatility doesn’t mean “risk” by itself, but it strongly affects risk. Higher volatility means your stop loss might be hit more often. It also means your target levels may need adjustment, otherwise the market won’t reach them often enough to make the strategy viable.

Example: If you trade a pair that regularly swings 80–100 pips in a day, but your setup expects 20–30 pip moves, you may find your entries are late or your stops are too tight for normal price behavior.

Liquidity: Why Execution Quality Shows Up in the Small Stuff

Even if your analysis is right, poor execution can wreck results. Major pairs usually have better depth, which tends to reduce sudden gaps caused by limited orders. Exotics can be trickier: spreads widen and prices can jump between levels.

If you’ve ever entered a trade, watched price move in your favor, then saw it snap back to your stop because it overshot—this is often what traders mean when they talk about liquidity and market microstructure. It’s not magic, it’s just how orders match.

Technical Analysis for Currency Pairs

In the exploration of currency pair dynamics, applying both technical and fundamental analysis can bolster trading decisions. Technical analysis involves studying price movements and chart patterns to predict future trends. It leverages various tools and indicators, such as moving averages and the Relative Strength Index (RSI), to identify potential entry and exit points.

Technical Levels Behave Differently Across Pairs

A support level on EUR/USD might hold more often than a similar-looking level on a high-volatility exotic. That doesn’t mean the concept is wrong—it means the probability distribution of price movement is different.

So when you run a technical setup, ask yourself: “Does this pair usually respect levels, or does it freewheel through them?” Your expectations should match the instrument.

RSI and Overbought/Oversold: Use It, Don’t Worship It

RSI can be helpful for spotting momentum extremes. But currency pairs—especially volatile ones—can stay “overbought” or “oversold” longer than you expect if a macro trend is strong.

Think of RSI as an alert light, not a stop sign. It tells you something about momentum conditions; it doesn’t guarantee a reversal will happen the next candle.

Fundamental Analysis for Currency Pairs

Conversely, fundamental analysis considers broader economic indicators and news events that might impact currency values. This includes interest rates, economic reports, and geopolitical developments. Successful forex trading often involves combining both analyses to provide a comprehensive view of the market.

Interest Rates: The Big Driver Behind Many Pair Moves

Interest rate differentials are a major force in forex. When one country’s interest rates rise relative to another, that can attract capital and support that currency.

This is why traders often watch central bank expectations closely. Rate rumors can create moves even before official decisions arrive.

Economic Releases: Scheduled Volatility

Jobs reports, inflation data, GDP readings, and manufacturing indexes can move currency pairs sharply. The effect depends on what the market expected and how the data compares to forecasts.

Two releases with the same headline can have different impact if expectations differ. In short: the surprise factor matters.

Geopolitics: The Unscheduled Event

Geopolitical developments can influence “risk sentiment.” When risk appetite falls, investors may move toward certain currencies perceived as safer, and away from others. Exotics can react more violently because the risk premium demanded by markets can change fast.

This is especially important when trading pairs that include currencies attached to emerging-market risk factors.

How to Combine Technical and Fundamental Views Without Getting Lost

Combining technical and fundamental analysis is usually about time horizons. Fundamentals often drive broader direction over days or weeks, while technicals help with timing entries and exits.

A practical workflow many traders use:

  • Check the calendar for major economic events relevant to the currencies in your pair.
  • Align your bias with the likely fundamental direction (or at least accept the risk of being wrong).
  • Use technical structure to choose levels for entry, stop, and target.

This reduces the classic beginner mistake: trading a perfect chart pattern right into a scheduled rate decision with a stop that’s too tight. Sometimes the chart is fine—the calendar just disagrees.

Enhancing Knowledge Continuously

The forex market is ever-evolving, influenced by numerous factors ranging from economic shifts to technological advancements. As such, traders should commit to continuous learning and adaptation. Utilizing informational resources, attending seminars, and engaging with forex communities can provide valuable insights and keep traders updated with the latest market trends and strategies.

Keep a Pair “Journal” for Better Pattern Recognition

One of the best habits isn’t flashy: track what you trade and how it behaves. For each currency pair you use, note:

  • Typical spread conditions
  • How it reacts to major news events
  • Whether your stop distances match normal movement

After a few months, your notes start to sound like a personality profile. Some pairs are calm, some are jumpy, some pretend to be logical until they aren’t. That’s just trading life.

Conclusion

Mastery in understanding how currency pairs are quoted in forex is a foundational requirement for effective trading. It necessitates a deep comprehension of base and quote currencies, nuanced interpretation of bid-ask spreads, and the ability to distinguish between different types of currency pairs and quote formats. For those seeking further insight into these fundamental elements, resources such as Investopedia can be beneficial. This foundational knowledge empowers traders to form informed decisions within the complex, dynamic forex market, guiding actions with prudence and confidence while navigating this vast financial realm.

The Future of Forex Trading: AI, Automation, and Trends

The Future of Forex Trading: AI, Automation, and Trends

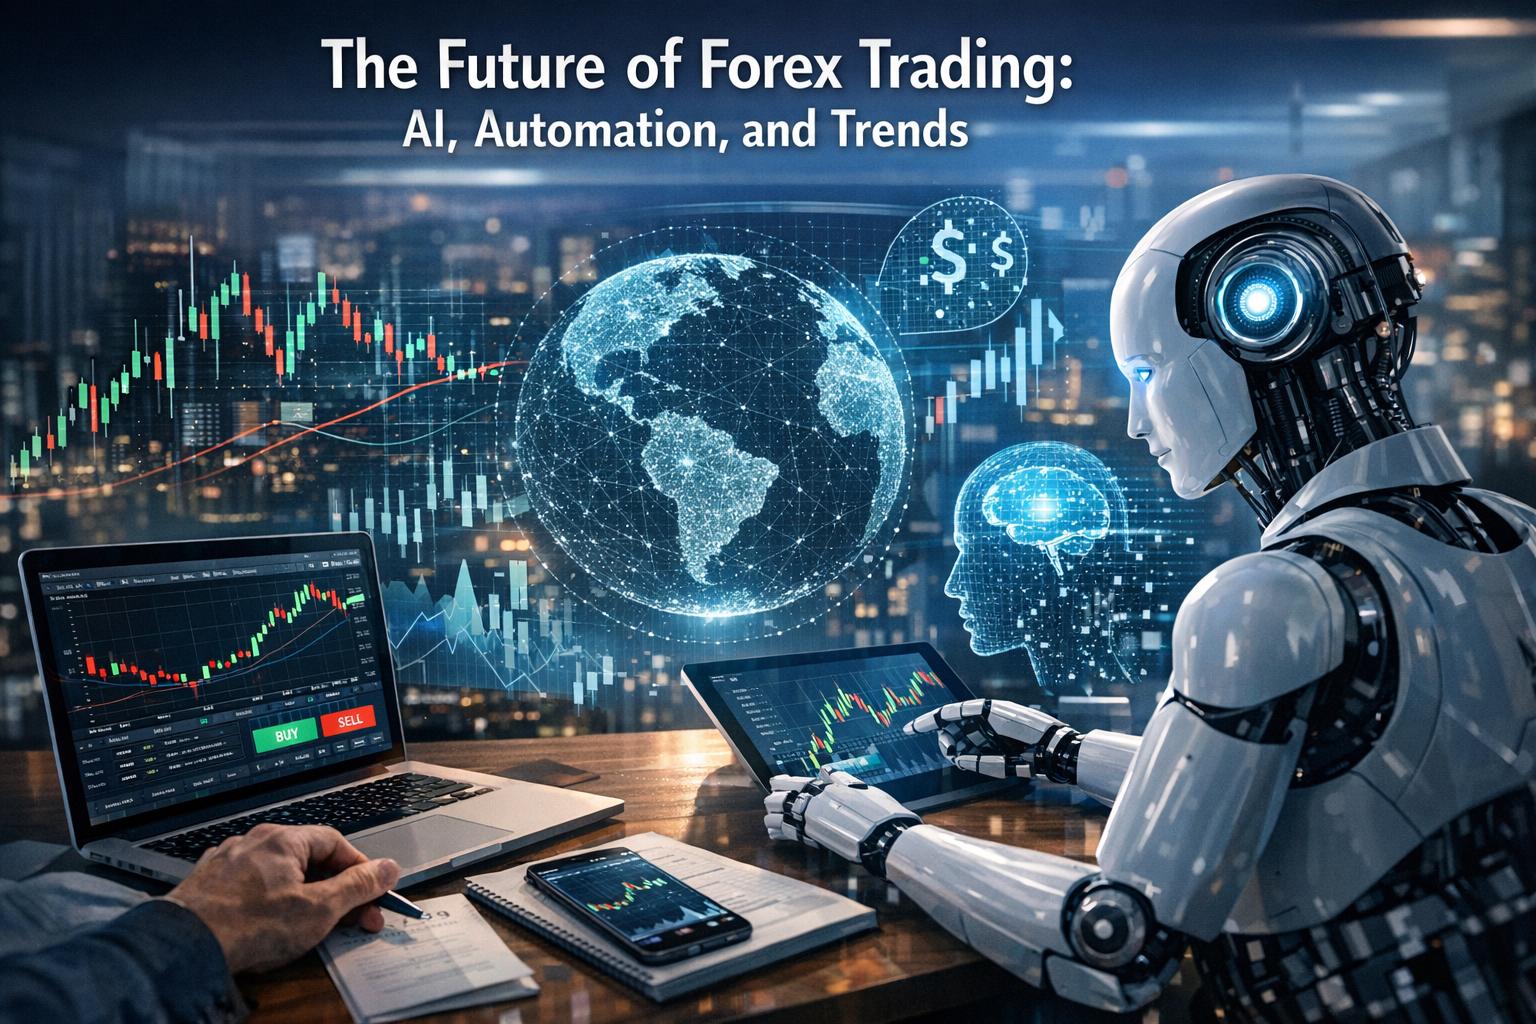
The Integration of AI in Forex Trading

The forex market moves in a way that makes humans feel like they’re always a few steps behind. Prices update constantly, headlines hit in real time, and liquidity shifts by the minute. So it’s not surprising that artificial intelligence (AI) has started showing up everywhere—from research desks at financial firms to screen-hungry retail traders. AI systems can process data faster than people, spot patterns that are hard to describe in plain English, and execute trades without pausing to “think about it.”

But the real change isn’t just speed. AI changes how traders form expectations about the market. Instead of relying only on manual chart reading or a fixed set of indicators, many traders now use models that learn from historical behavior and react to new information as it arrives. That means fewer decisions are based purely on gut feel and more are based on calculated probabilities.

In practice, AI-driven systems use historical data, chart patterns, and market signals to estimate likely price paths. Machine learning techniques can adjust those estimates over time as more data comes in. When done well, the result is a trading workflow that is more consistent, more disciplined, and better at dealing with uncertainty—at least more than the “try harder and hope” method most of us have probably used once or twice.

Automation Takes Center Stage

Automation has become the practical doorway that many traders walk through when adopting AI. Automated trading systems—often called “forex robots” or algorithmic trading programs—follow a set of rules for opening and closing trades. When those rules include AI-based signals, the system can react quickly to changing conditions without requiring constant monitoring from the trader.

The appeal is obvious. Automation reduces the influence of emotions like fear and overconfidence. It also cuts down on human mistakes that happen during busy hours, like clicking the wrong button or forgetting that a stop-loss exists. A good automated setup won’t care whether you’re tired after work. It just follows the plan.

Another advantage is the ability to operate 24/7. Forex doesn’t politely stop at the end of the trading day. Automated systems can watch multiple pairs, multiple timeframes, and multiple risk constraints at once, while still placing orders quickly enough to matter.

That said, automation is not “set it and forget it forever.” AI and automated execution systems still need monitoring. Markets change, data quality shifts, brokers change pricing behavior, and the model that worked last year might behave poorly if conditions evolve. The system should be supervised like a junior employee: you can trust it to do the tasks, but you still check whether it’s doing them correctly.

From Manual Rules to Model-Driven Decisions

Traditional trading strategies usually depend on meticulous analysis. Even discretionary traders—people who decide entry and exit points themselves—typically follow a personal logic based on indicators, support and resistance levels, and macro context. The weakness is that human decision-making can be inconsistent, especially when the market chops around and the temptation to “revenge trade” shows up.

Automated systems flip that pattern. They use predefined parameters to decide whether conditions meet a trade trigger. In many setups, the parameters include risk limits such as maximum drawdown, maximum open positions, and rules for managing spread slippage.

Where AI enters the picture, it often helps determine which conditions are most likely to produce favorable outcomes. For example, an AI model may analyze the relationship between news sentiment, volatility, and immediate price action to decide whether the next breakout is genuine or likely to fail.

This shift supports higher-frequency behavior. While most retail traders won’t run true high-frequency trading infrastructure, the broader idea still matters: automated systems can act more rapidly and consistently than manual methods, reducing the time lag between a signal appearing and a trade being placed.

High-frequency trading (HFT) uses automation to make dozens or even hundreds of trades in extremely short time intervals, often targeting small inefficiencies. In theory, small price differences add up. In practice, HFT relies on advanced execution, low-latency environments, and careful risk controls—so don’t assume anyone with a laptop can replicate that. Still, the underlying logic of “faster, more consistent execution” has pushed many less extreme automated systems forward too.

How AI Models Actually Use Market Data

AI in forex isn’t magic; it’s applied pattern recognition plus statistical inference. The market provides inputs, and the model outputs a decision or a forecast. The hard part is choosing the inputs and setting the training process so it generalizes rather than memorizes.

Common data sources include:

  • Price and volume: open, high, low, close data; tick volume; and derived metrics like returns and volatility.
  • Technical indicators: momentum measures, moving averages, oscillators, and volatility bands.
  • Market structure signals: order flow proxies, spread behavior, and short-term liquidity changes.
  • Macro and news signals: interest rate expectations, economic surprises, and sentiment indicators.

Then the model learns relationships between those inputs and outcomes. Outcomes might be future returns over a time horizon, probability of a trend continuing, or likelihood of a stop-loss getting triggered before a take-profit level.

One reason AI is popular here is that forex data is rich enough for experimentation. Traders can test hypotheses quickly across multiple currency pairs and timeframes—without traveling to a lab or building a rocket. The temptation, of course, is to run too many tests and end up with something that works by coincidence. That’s why evaluation methods matter.

Automation vs. AI: They’re Related, Not Identical

It helps to separate automation from AI. Automation describes the “execution engine.” AI describes the “prediction or decision engine.” You can automate without AI by using fixed rules, like “if RSI crosses above 70, short.” You can use AI without full automation by letting it suggest trades while a human decides what to do next.

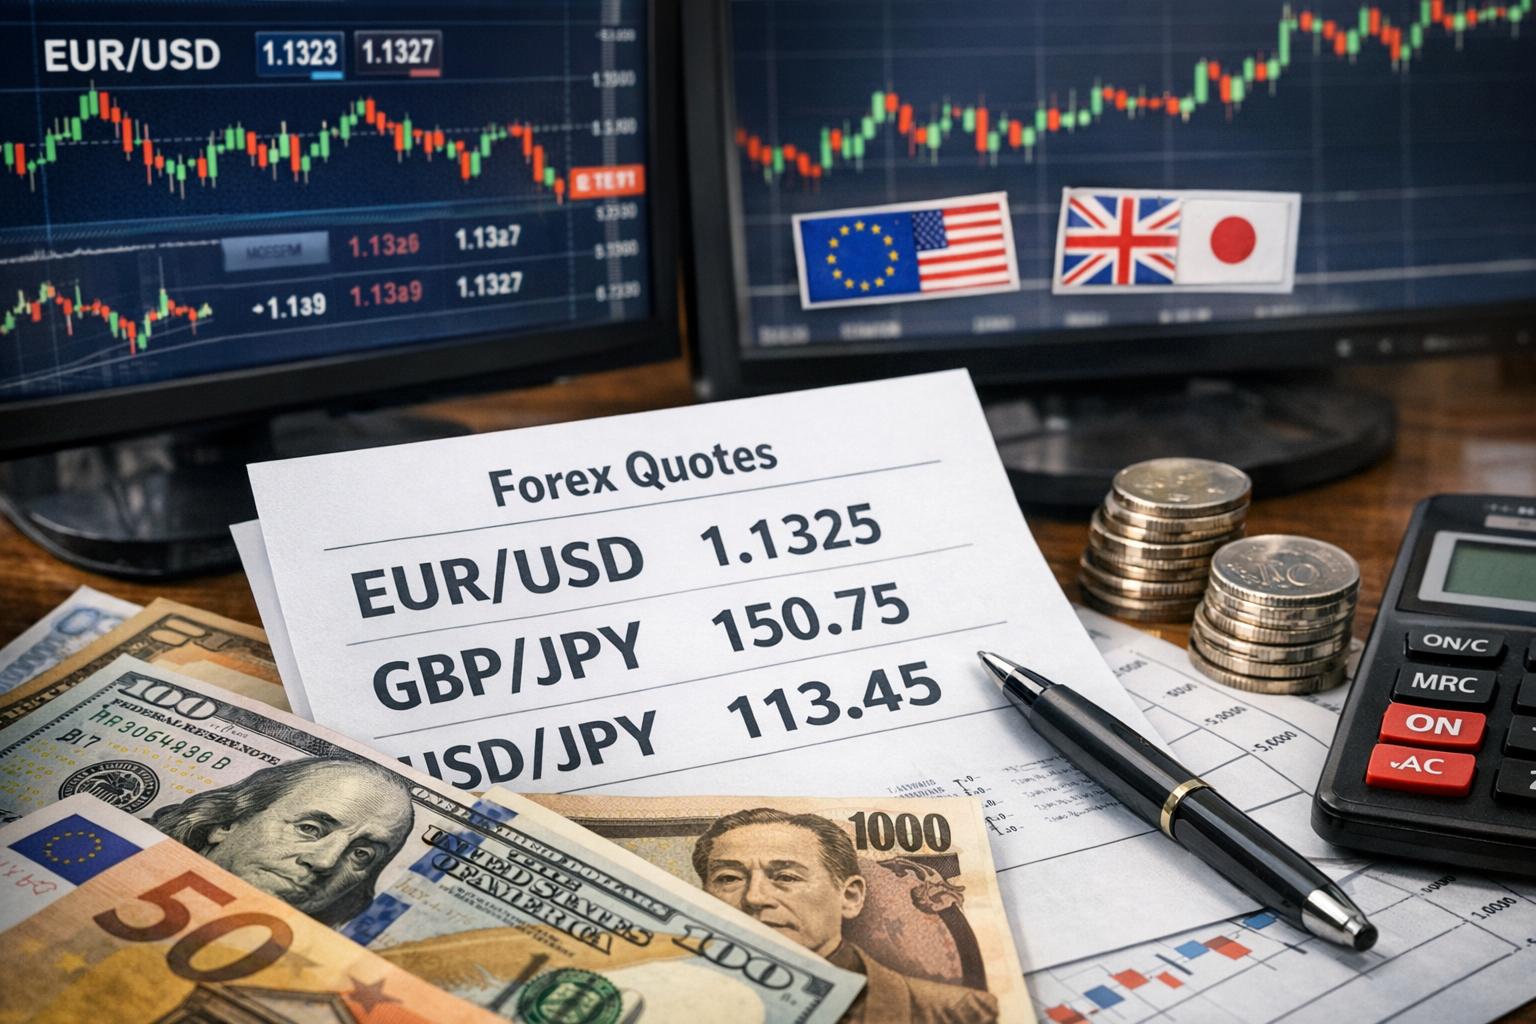
Most modern systems blend the two: AI generates signals, and automation translates signals into orders with predefined risk management. For example, an AI model might output a probability that EUR/USD will rise by at least a certain amount within the next hour. The automated layer then uses that probability to decide whether to enter, size the position, and set stop-loss and take-profit levels.

Done reasonably well, that workflow reduces some of the operational messiness that humans can introduce—like changing risk rules mid-trade because the market “feels different” today.

Emerging Trends in Forex Trading

The forex market changes in ways that go beyond trading software. Traders also face shifting regulations, evolving infrastructure, and new technologies that affect settlement and verification. Here are a few themes that keep showing up as the market adapts.

Regulatory Scrutiny in Major Trading Hubs

Regulators have become more active in major trading centers, and that affects trading behaviors indirectly. Compliance rules influence broker operations, client protections, reporting requirements, and sometimes even acceptable marketing or leverage practices.

For traders, the impact is practical. If your broker changes reporting or if your account type gets reclassified, your execution environment might change—spreads might widen, order types might behave differently, or margin rules might tighten. That affects performance even if your strategy hasn’t changed.

Because of that, traders who use AI systems still need to track policy updates. A model can be brilliant and still lose money if the execution conditions violate assumptions it was trained on. In other words: the math doesn’t matter much if you can’t trade the way the model expects.

Blockchain Technology for Settlement and Traceability

blockchain technology is making headway in finance, including parts of the FX ecosystem. Its promise is straightforward: improved security, transparency, and efficiency. The main area of interest tends to be settlement processes and reducing counterparty risk through better verification.

Blockchain’s decentralized design means transactions are recorded in a way that’s harder to tamper with later. That can reduce disputes and fraud risk, which matters when multiple parties interact with different internal controls. For traders and brokers, trust in the integrity of recorded trades is not a small thing—it’s basically table stakes.

That said, blockchain implementations aren’t uniform. Different platforms, different rules, and different adoption timelines mean not every claim will apply to every participant. Still, as more infrastructure matures, the likelihood of broader use in trade settlement grows.

The Role of Big Data in Decision Making

AI doesn’t learn from thin air. It needs data, and that’s where big data becomes relevant. Forex trading can involve multiple streams: price history, macro indicators, order book information proxies, and sentiment measures. When combined, these data sources can help generate a more complete picture of market conditions.

Big data analytics helps traders identify patterns that don’t show up easily when you only stare at one chart. For example, volatility can rise without a corresponding directional trend, or sentiment can shift before price visibly reacts. By capturing relationships across multiple variables, analytics tools support more thoughtful scenario testing.

In day-to-day trading terms, big data helps with:

  • Model input enrichment: adding more context about volatility, macro timing, and behavior around events.
  • Risk management logic: estimating how spreads and volatility might impact stop-loss placement.
  • Scenario simulation: running “what if” tests on how the model might behave under stress.

Machine learning methods can then sift through large volumes of data to discover correlations between market variables. The important word here is correlation, not certainty. Models might find patterns that look repeatable, but markets can always break rules—especially around regime changes like major policy shifts or unexpected economic shocks.

Practical Example: Where AI Helps Most

Consider a common situation for many traders: you see a setup on a chart you like, but the market is choppy around the entry. Sometimes the signal works. Sometimes it doesn’t. The difference might not be obvious from a simple indicator reading.

An AI-enhanced approach might add additional context. It could evaluate whether the signal occurs in a high-volatility environment or after a burst of news that often drives short-lived moves. It might also measure whether price action shows a tendency to revert rather than continue.

Instead of saying “buy because the chart looks good,” the system might say “buy only if the probability estimate clears a threshold based on how similar conditions performed historically.” That shift can reduce the number of low-quality trades, even if it doesn’t turn every losing trade into a winner.

Data Quality Matters More Than Most People Admit

AI performance is inseparable from how data is collected and cleaned. In real trading, data comes with quirks: missing ticks, inconsistent timezones, broker-specific spread behavior, and differences between backtest feeds and live execution.

Even a well-trained model can degrade if it meets conditions that didn’t exist in training data. A strategy might look perfect in a backtest because the simulation treated slippage politely. Live trading rarely does that. So traders implementing AI systems should pay close attention to data pipeline quality, not only the algorithm itself.

A practical way to sanity-check a model is to compare signals it produces across periods with different volatility regimes. If the model only behaves well during calm markets, that’s a warning label—not a surprise.

Automation, Risk, and the “Have You Actually Measured It?” Test

AI systems are often marketed as predicting the future. In reality, they better predict the odds of certain outcomes given certain inputs. That distinction matters when you integrate automation into a real trading process. If the model output is probabilistic, your trading rules should also be probabilistic. You should treat risk management as part of the model’s job, not an afterthought you bolt on later.

Position Sizing and Stop-Loss Logic

Many automated systems fail not because their signals are wrong, but because the risk controls are too simple. Over-leveraging is the fastest way to turn a “generally profitable” model into an account deletion event.

In a robust AI-driven setup, position sizing often depends on volatility and model confidence. For example, when volatility rises, the expected movement within the next horizon grows, so the stop-loss might need adjustment. If confidence is low, the system might reduce position size or skip the trade entirely.

Stop-loss and take-profit placement also matters. Fixed pip distances can behave differently across changing spread conditions. A model trained with one spread pattern might struggle if the broker’s spread widens during news events.

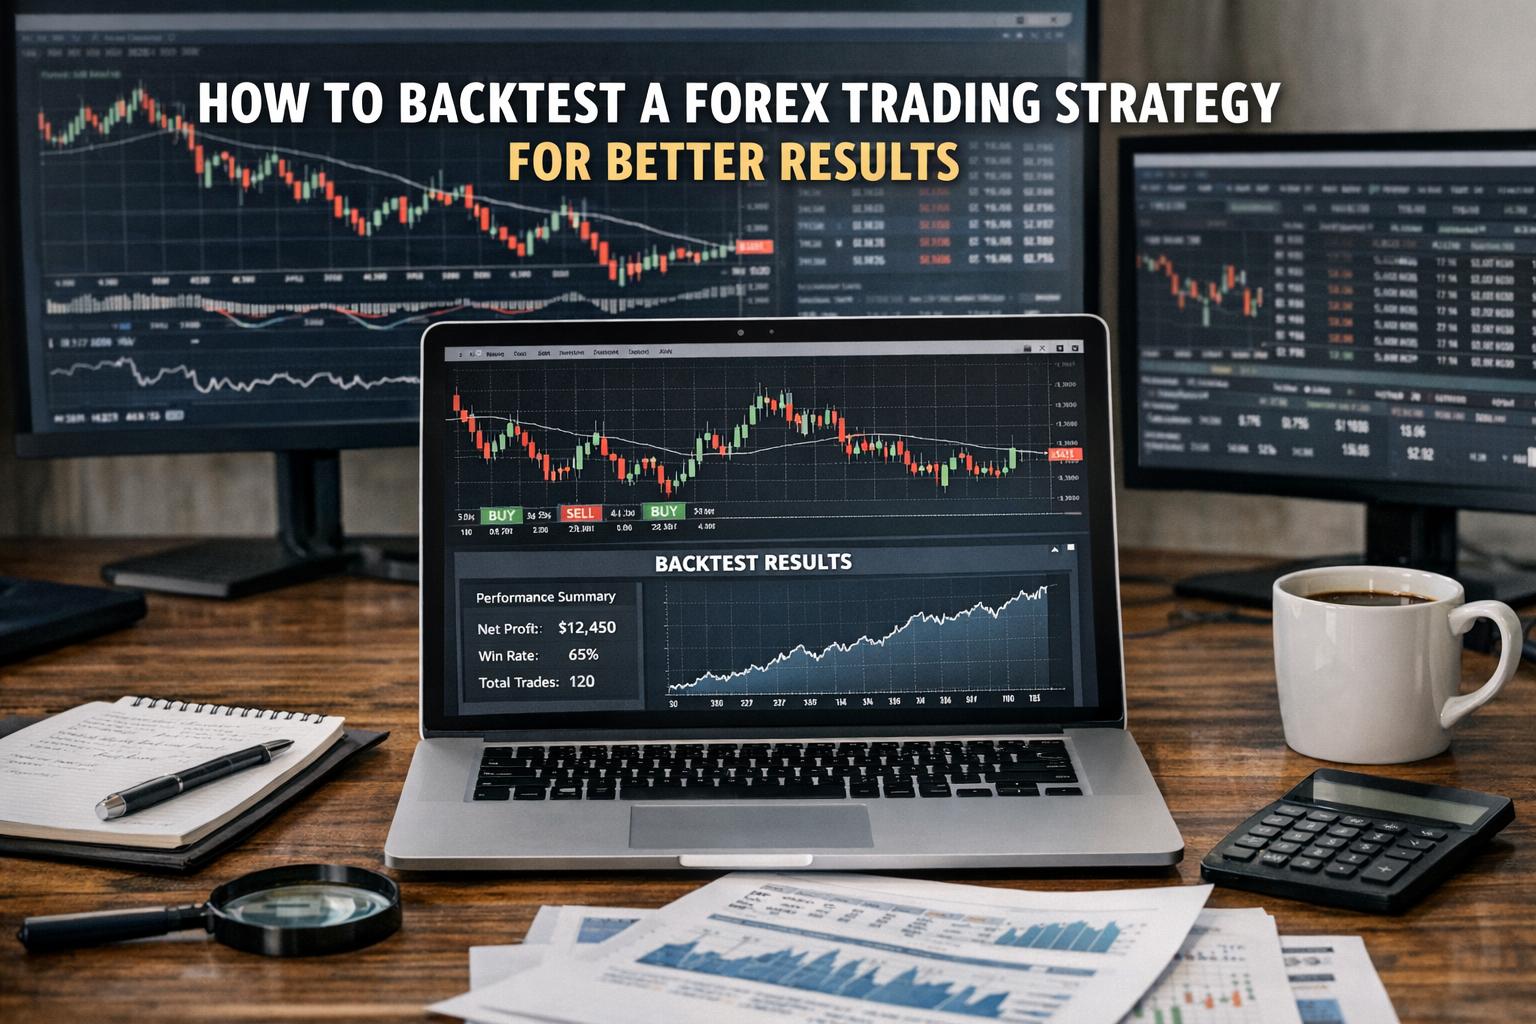
Backtesting: Useful, But Not the Whole Story

Backtesting is where many traders pin their hopes. It can show whether a strategy has historical merit, but it can also mislead if executed incorrectly. For AI-driven systems, the risk of overfitting is real. Overfitting happens when a model learns noise instead of signal—so it performs great on historical data, then falls apart in live markets.

To reduce that risk, traders typically use:

  • Out-of-sample testing: training on one period, testing on another.
  • Multiple timeframes and validation across different market regimes.
  • Walk-forward validation: repeating training and testing in rolling windows.

None of these guarantee success, but they prevent the most common self-inflicted wounds.

Monitoring in Live Trading

Even a well-built system should be monitored. AI models can drift when the underlying input distributions change. A different economic calendar, a new broker liquidity profile, or changes in volatility behavior can all shift the environment.

Monitoring also helps identify operational issues. For example, if an automated system starts missing trades due to connectivity problems or order rejection, the backtest performance stops being relevant. A surprising number of “the strategy stopped working” incidents are really “the execution broke” incidents.

So, if you’re using automation, set up logging and alerts. You want to know when signals change, when orders get rejected, and when spreads behave abnormally. Traders who treat the machine like a black box usually learn hard lessons.

Where AI Fits Best: Style of Trading and Use Cases

Not every trading style benefits equally from AI. The fit depends on your time horizons, your tolerance for risk, and your willingness to manage a system rather than simply trade it.

Short-Term and Event-Driven Trading

AI tends to shine when markets respond quickly to changing information—like economic releases, central bank statements, and major geopolitical headlines. Even then, the model must handle the reality of fast-moving spreads and unpredictable execution. A signal that looks correct in slow historical data can fail if the live market whips around during a news spike.

Still, AI can be useful by detecting patterns around event timing. Instead of simply trading whenever news breaks, it can estimate when the market’s reaction is likely to trend versus when it’s likely to fade.

Trend Following and Regime Detection

Some traders prefer trend-following strategies. AI can improve these by identifying which “regime” the market is in—trending, ranging, or transitioning after a volatility expansion.

In a regime-based system, AI doesn’t just predict price direction; it predicts which strategy logic is more likely to work right now. That can reduce whipsaws when markets chop sideways. The benefit isn’t that the model becomes omniscient. It’s that it stops pretending the same strategy works in every condition.

Risk-Focused Strategies

Another practical use case is building strategies where the model primarily predicts downside risk. Instead of maximizing returns at all costs, the system tries to avoid periods where losses are likely larger than expected. Even if that reduces trade frequency, it can improve risk-adjusted performance.

This also fits the reality that traders often care more about drawdown than about the “perfect” entry point. Many people don’t blow up from one bad trade. They blow up from a streak of bad luck paired with oversized risk. Risk-focused AI can help interrupt that pattern.

Common Problems When Using AI and Automation in Forex

AI adoption in forex comes with plenty of optimism, and optimism is great—until it meets accounting and drawdowns. Here are the issues that repeatedly surface.

Overfitting and Performance Illusions

Overfitting is the classic problem. A model might learn very specific patterns that existed in the training period only. When the market changes, those patterns disappear. Two years later, you’re watching a system that used to behave like a philosopher now behave like a drunk poet.

To reduce this, people should validate using multiple time periods and consider simpler models when possible. Simpler doesn’t mean worse—it can mean more stable.

Data Leakage

Data leakage happens when the model unknowingly gets access to information it wouldn’t have in the real world. It can occur through mistakes in feature engineering or incorrect alignment between inputs and outputs. Once leakage is in play, the backtest becomes a misleading story.

In AI-driven trading, even small leakage can create what looks like “prediction skill” that evaporates in live trading. It’s worth checking that all features are available at the time of prediction.

Execution Slippage and Broker Variability

Forex trading happens through brokers, liquidity providers, and execution infrastructure. Two brokers can offer different spreads and different order fill behavior even for the same symbol.

AI models trained with one execution style might need adjustment when moved to another broker. This is why model portability is often limited. Traders who build a strategy and immediately change brokers should take extra care and use realistic assumptions in backtests.

Model Drift and Regime Changes

Markets don’t stay still. When inflation regimes shift or central bank behavior changes, the historical relationships that AI learned can weaken. AI systems can be updated and retrained, but retraining introduces its own risks and costs.

A well-run trading operation includes a plan for updating models when appropriate. That plan should define how much new data to use and what performance gates need to be met before switching the live system.

Putting It All Together: A Responsible AI Trading Approach

The integration of AI in forex is real, and it’s spreading for understandable reasons: faster processing, automated execution, and the ability to analyze large sets of signals. But responsible adoption still means treating AI as a tool, not a promise.

A practical approach looks like this:

  • Use AI where it adds measurable value, like signal filtering, probability estimation, or risk forecasting.
  • Automate execution only with risk controls that reflect how the system will behave live.
  • Test properly with out-of-sample evaluation and realistic assumptions about spreads and slippage.
  • Monitor ongoing performance and operational metrics, not just returns.

This is also where the emerging trends connect. Regulatory scrutiny affects broker conditions and reporting, blockchain efforts aim to improve settlement trust, and big data helps AI models extract signal from noise. Put together, these forces push trading toward more structured, more measurable workflows.

Practical Reading for Ongoing Updates

If you want to keep up with how these developments change the trade environment, specialized finance resources can help with context, terminology, and market timing. For example, market participants often reference financial websites when tracking updates and explanations around forex mechanics, AI adoption, and broader financial technology trends.

Final Thoughts

The future of forex trading increasingly blends AI, automation, big data analysis, and emerging technology like blockchain. The point isn’t to “replace traders” with machines. It’s to reduce guesswork, tighten risk control, and make execution more consistent.

AI-driven systems can analyze market trends, predict likely movements, and execute trades with speed that humans can’t match. Automation turns those signals into action, often with a discipline humans struggle to maintain when the market gets noisy. Big data supports the modeling work by improving the range and quality of information. And blockchain, while still developing in many places, points toward more transparent settlement and verification.

In the end, a trading setup succeeds or fails based on fundamentals: data quality, realistic backtesting, robust risk controls, and honest monitoring. Technology helps, but it won’t carry the trader. If you treat AI as a disciplined assistant rather than a fortune teller, it’s more likely to earn its spot on your workflow than take over your life like an overly confident spreadsheet.

How to Backtest a Forex Trading Strategy for Better Results

How to Backtest a Forex Trading Strategy for Better Results

Understanding Backtesting in Forex Trading

Backtesting is how many Forex traders sanity-check their ideas before they risk real money. The basic idea is simple: you define a trading strategy, then apply it to historical market data to see how it would have performed. If the results look promising and the risk profile doesn’t look like a car crash, you move closer to live trading. If the results look like random noise (or worse, like a consistently losing pattern), you revise the plan or scrap it.

A quick reality check, because markets don’t care about our feelings: backtesting shows what a strategy might have done in the past, not what it will do tomorrow. Still, it’s one of the few ways to test your logic in a measurable way. Done properly, backtesting can expose flaws in entry rules, stop-loss assumptions, and position sizing long before you pay for them with a live account.

Why Backtesting Matters (Beyond “It Looks Good”)

Forex is noisy. Prices move for reasons ranging from macroeconomic surprises to thin liquidity hours where spreads can behave badly. Without a systematic test, traders tend to fall into pattern-matching. You see a chart and think, “I could trade that.” Then live trading arrives, spreads widen, execution slips, and the trade doesn’t behave like it did in your head.

Backtesting helps by forcing your strategy into a structured test. It answers questions such as:

1) Would the strategy have triggered trades at the times it claims to?
2) Did the expected take-profit and stop-loss logic play out realistically?
3) How often did the strategy hit drawdowns that you can actually survive emotionally and financially?
4) Are profits driven by something repeatable, or by a lucky stretch that won’t likely repeat?

When traders say a strategy has a “statistical edge,” they usually mean it has demonstrated some kind of repeatable performance in historical tests. Backtesting is the process that helps you measure that edge (or admit when you don’t have one).

Backtesting’s Hidden Job: You’re Testing Assumptions

Most people focus on the strategy rules: entries, exits, indicator settings, and filters. That’s fair, but the bigger risk is that backtesting also tests your assumptions about market behavior, trading costs, and execution.

Example: if your backtest ignores spread, commissions, slippage, or uses unrealistic fill rules, it can make a strategy look profitable when it wouldn’t be in real conditions.

So, backtesting isn’t just about “did it win?” It’s also about “did it win after acknowledging the stuff that usually kills fragile edges?”

Data Collection: The Foundation of a Meaningful Backtest

Backtesting lives or dies on the data. If your historical price series is incomplete, adjusted in inconsistent ways, or uses data that doesn’t match the broker’s feed style, you end up testing against an alternate market.

At a minimum, traders need:

– Accurate historical price data for the chosen currency pairs
– Enough history to cover different regimes (trending, ranging, high-volatility, calm periods)
– Price data at the same timeframe you plan to trade, plus possibly lower timeframes for more realistic execution modeling
– Data sourced in a way that is consistent across the years you’ll test

Quality matters because inaccurate data can create false signals and distort indicators. A moving average-based strategy might look stable in one dataset and flaky in another simply because minor price differences can cascade through indicator calculations.

What “Good” Historical Forex Data Looks Like

In practical terms, good data has three traits:

1) It’s consistent with your intended trading setup (time zone, session handling, broker conventions).
2) It’s granular enough for your strategy logic. For example, a strategy that depends on price crossing a level may behave differently if the data is too coarse.
3) It doesn’t silently change underneath you. Some providers assemble and clean data in ways that can differ from session rubrics or candle construction.

This is also where traders get to learn a mild, unpopular lesson: “Same timeframe” doesn’t always mean “same candles.” Time zone conversions, candle boundaries, and data formatting can shift signals.

Timeframes: Align Your Backtest With Reality

A strategy might be built on a higher timeframe (like 1H) but executed with a lower timeframe (like 15M). If you only backtest on the higher timeframe and assume perfect fills, your results can look better than what you’d actually get.

A common real-world workflow looks like this:

– Build signals on the timeframe you use to identify setups
– Evaluate execution using a smaller timeframe, if your entry logic requires it
– Still model spread and slippage assumptions so you’re not pretending trades fill at mid-price every time

The goal isn’t to build a perfect simulator. The goal is to avoid testing something that has no connection to the way you’ll trade.

Handling Forex Costs: Spreads, Commissions, and Slippage

Forex trading isn’t free. Any backtest that ignores costs should be treated as a rough draft, not a verdict. Costs come in at least three forms:

– Spread: the difference between bid and ask at entry/exit
– Commission (if your broker charges it)
– Slippage: when your desired fill price differs from the actual fill, often during fast moves or low liquidity

Slippage can be the silent profitability killer for strategies that rely on tight stop-loss distances or quick scalping entries. If your system aims for small gains, even a few pips of consistent slippage can erase the edge.

Even if your exact slippage is unknowable, you can still test using reasonable assumptions (for example, “average slippage of X pips when volatility is above Y”).

Choosing the Right Software

Software matters because it determines how your strategy is applied, how trades are simulated, and how results are calculated. Many traders use established platforms that provide backtesting and automation.

MetaTrader

MetaTrader (especially MT5) is one of the most common choices because it’s widely documented, supports algorithmic execution, and offers backtesting tools for strategies and trading robots. Beyond convenience, the advantage is that traders can iterate quickly: adjust rules, re-run tests, compare metrics.

However, no platform is perfect. Two traders might run the “same” strategy in two tools and get slightly different results due to differences in:

– how candles are constructed internally
– how order execution is modeled
– how variable timing is handled
– defaults for spread or fill assumptions

That doesn’t mean you should abandon the platform. It just means you should understand what the platform does by default, and adjust the settings so your test resembles your broker’s reality.

Developing a Strategy: Write Rules That Don’t Need Guessing

A strategy needs to be defined with enough precision that it can run without you hovering over it like a nervous parent. Vague rules are the enemy of meaningful backtesting.

To backtest effectively, your strategy typically needs:

– Entry logic (what conditions trigger a buy or sell)
– Exit logic (profit taking and stop-loss placement)
– Risk rules (position sizing method, max risk per trade)
– Trade management rules (trail stops, partial closes, break-even logic)
– Filters (news avoidance, volatility filters, session restrictions, etc.)

If your rules depend on discretion (“enter when it feels right,” “exit when momentum looks weak”), you’ll have to translate that into measurable conditions. Backtests can only run what you can define.

Common Strategy Types in Forex Backtesting

Most Forex strategies fall into recognizable categories:

– Trend-following systems (moving averages, breakout logic, channel logic)
– Mean reversion systems (z-score style logic, bands, oscillators with risk-managed exits)
– Volatility-based systems (ATR logic, breakouts conditioned on volatility)
– Price action systems (support/resistance rules, candle structure filters)
– Event or calendar-based systems (less common, but sometimes tied to macro releases)

Backtesting works for all of these, but the realism you need varies. For example, a mean reversion strategy that relies on exact touches might be more sensitive to spread and candle construction than a trend system that reacts to larger swings.

Executing the Backtest: How Trades Are Simulated

When you run a backtest, your strategy rules get applied to the historical data to generate a sequence of hypothetical trades. The platform then records outcomes based on its execution model.

Your attention should focus on the simulation details. Questions to ask:

– Are trades opened at the candle close, candle open, or at a specific price level?
– How does the system handle stop-loss and take-profit within a candle (especially if both could be touched in the same period)?
– Does the backtest allow multiple positions (or does it only track one at a time)?
– Are margin rules enforced (so the strategy can’t open trades that are impossible due to leverage limits)?

These details affect results more than people expect. A strategy can look profitable simply because the simulator chooses a favorable fill sequence for intrabar movement.

Important Metrics to Record

Most platforms provide a standard set of performance metrics. You should still know what they mean, because “profitable” doesn’t always mean “tradeable.”

Key metrics include:

– Net profit and profit factor (gross profit vs gross loss)
– Win rate (percentage of winning trades)
– Average win and average loss (important for understanding risk-reward)
– Maximum drawdown (how bad the equity dip gets)
– Sharpe ratio or similar risk-adjusted measures (varies by platform)
– Number of trades (low trade counts can make results look deceptively stable)

A strategy with a high win rate but huge losses can be emotionally brutal in live markets. Conversely, a strategy with fewer wins but controlled losses might be more sustainable.

Analyzing Results: Don’t Stop at the Profit Line

After the backtest finishes, you’re not done. You need to inspect what happened and why.

Look for three broad categories of insight:

1) Performance consistency across time
2) Behavior under different market regimes
3) Sensitivity to parameters

Performance Consistency: Break the Test into Chunks

A classic trap is celebrating performance driven by a small portion of the backtest period. For instance, you run a 10-year test and profits show up mostly during the middle years, while the rest is messy.

A quick way to check this is to examine results by year or by rolling time windows. If the strategy is profitable in multiple separate periods, it’s more credible than a strategy whose entire edge comes from one special stretch.

Drawdown Analysis: Can You Actually Survive It?

Maximum drawdown isn’t just a number for bragging rights. It indicates how deep your account equity may dip during losing sequences.

Even if a strategy eventually recovers, you might not have enough capital or emotional stamina to wait out the rough patches. This matters because brokers enforce margin requirements. If your drawdown causes margin calls before recovery, the strategy dies in practice.

So treat drawdown as a real constraint. A profitable strategy that regularly demands far more capital than you can provide is not a practical strategy.

Trade Distribution: Are Gains Concentrated?

Some systems produce steady results; others produce gains in a few large trades. Concentrated profit can be fragile because it depends on occasional conditions aligning perfectly.

If your average trade behavior changes unpredictably when you shift the dataset slightly, that’s not a great sign. You want a strategy that behaves reasonably even when the market doesn’t politely follow your spreadsheet.

Optimization: The Risk of Overfitting

Optimization is what many traders do next: they tweak strategy parameters (indicator period lengths, thresholds, stop-loss sizes) to find combinations that improve metrics.

The problem is over-optimization. When you tune too hard to the historical dataset, you might create something that performs brilliantly in that dataset and poorly in live markets.

A strategy that matches past prices too closely often isn’t capturing a real market behavior. It’s capturing quirks of the data. In other words, it learned to cheat. Markets don’t care about your cheat sheet.

How to Reduce Over-Optimization

You can lower the risk with a few good habits:

– Use out-of-sample testing (train on one period, test on another)
– Limit parameter ranges to realistic areas
– Avoid optimizing for too many variables at once
– Prefer simpler models when performance is similar

If you can get nearly the same performance with fewer tuned parameters, that’s usually healthier.

Watch Out for “Perfect” Performance

When results look almost too clean—near-constant equity growth, tiny drawdowns, and high profit factor across all periods—that can be a sign that the backtest assumptions are too optimistic or the strategy is overfit.

It’s not impossible for strategies to look strong in backtests. But when everything looks perfect in a single run, double-check spreads, slippage, fill rules, and the data you used.

Forward Testing: The Bridge from History to Live Trading

Once your backtest results look reasonable, forward testing asks a simpler question: does it still work when the strategy hasn’t “seen” the future yet?

Forward testing means running the strategy in real-time market conditions, usually on a demo account first. This step matters because backtests can be overly idealized. Live conditions can introduce differences in execution and timing.

Why Demo Forward Tests Still Matter

Demo trading uses live market data but typically doesn’t replicate every part of execution exactly as a live broker account does. Still, it catches common issues:

– Incorrect timeframe syncing
– Indicator calculation differences
– Strategy logic errors that only appear during live streaming data
– Operational mistakes (like order handling or risk settings)

If your strategy can run correctly in forward testing without exploding due to a rule misfire, you’re moving in the right direction.

How Long Should You Forward Test?

There’s no universal number of days or months. But as a rule, forward testing needs enough time to encounter different market behavior. Trading one week only covers a tiny slice of reality.

If your strategy performs mainly in trends, you’ll want to see trend and non-trend conditions. If it relies on volatility expansions, you need those bursts to occur during the test period.

Realistic Expectations: Backtesting Isn’t a Magic Wand

Backtesting isn’t a “guarantee of future profit.” It’s a method of estimating how your strategy might behave under past conditions and then using that estimate to improve your odds.

The biggest mistake traders make is treating the backtest as a verdict rather than a diagnostic tool. The best traders treat it like a lab report: if results look abnormal, they investigate why.

Some strategies that backtest well still fail in live trading. That could be due to spreads changing, slippage increasing, execution differences, or the market simply shifting regime.

On the flip side, strategies that backtest only “okay” sometimes perform better live, especially if the simulator is too conservative or doesn’t model execution accurately. So keep your mind open—up to a sensible point, and not in a “reinvent your rules every day” way.

Common Backtesting Mistakes Traders Keep Making

If you’ve been in trading for more than five minutes, you’ve probably seen at least one of these.

Using Too Short a Test Period

A short sample can miss relevant market regimes. If you only test during a calm phase, your strategy might appear stable while ignoring how it behaves during high volatility.

Ignoring Costs

Backtests without spread and slippage often overstate performance. Even if the strategy is strong, costs determine whether it still makes money after friction.

Look-Ahead Bias

Sometimes traders accidentally incorporate future information into the strategy logic. Examples include using indicators computed with data that would not be available at decision time, or using candle data incorrectly.

Good backtesting tools reduce this risk, but it’s still something to verify, especially when custom code is involved.

Overfitting Through Excessive Parameter Searches

If you keep adjusting until the backtest curve becomes pretty, you’re probably training a strategy to past noise.

Not Stress-Testing the Strategy

Even if the strategy performs well in the exact dataset you used, it should be stress-tested using variations such as:

– different time periods
– slightly different spread assumptions
– different position sizing
– different risk settings

This doesn’t mean you need 50 re-tests every time. It means you need enough variety to avoid fooling yourself.

Practical Example: What a Sensible Backtesting Workflow Looks Like

Here’s a workflow many careful traders end up using, with fewer dramatic leaps and more boring checkpoints (which is good):

– Choose a currency pair and define whether your strategy is meant for that pair specifically or for multiple pairs.
– Gather historical data with consistent candle construction and enough history (ideally covering different volatility regimes).
– Build the strategy with clearly defined entry/exit rules, including stop-loss and take-profit mechanics.
– Use a backtesting platform to run the strategy with realistic spread assumptions and, if possible, slippage modeling.
– Evaluate performance using more than just net profit: check drawdown, win/loss profile, and whether performance is consistent across sub-periods.
– Optimize cautiously if needed, and verify results using out-of-sample data.
– Forward test on demo accounting for execution details and operational correctness.
– Only then consider live trading with small position sizes to validate behavior under real broker conditions.

This approach isn’t glamorous. But it does prevent the kind of “it worked in the backtest, so I went live” moment that ends with a very quiet trading log and a louder bank statement.

Conclusion

Backtesting remains a core part of Forex trading because it gives traders a measurable way to evaluate strategy logic using historical data. It helps you test whether entry and exit rules work together, whether your risk assumptions survive losing sequences, and whether a strategy’s performance holds up across different periods.

That said, backtesting isn’t infallible. The quality of your data, the realism of execution modeling, and the risk of over-optimization all influence what you see in the results. The better you treat backtesting as an investigation—supported by forward testing rather than treated like a final verdict—the more likely you are to build a strategy that can survive contact with live markets.

If you want the short version: backtest what you can prove, forward test what you can validate, and keep adjusting based on evidence, not hope. The Forex market changes, but your process doesn’t have to be random.

What is a Forex Trading Signal and How to Use It?

What is a Forex Trading Signal and How to Use It?

Understanding Forex Trading Signals

Forex trading signals are tools traders use to time their entries and exits in the foreign exchange market. In plain terms, a signal is a message—human-written or algorithm-generated—that tells you when a currency pair may be worth buying or selling. Most signals come with trade parameters so you can act quickly without staring at charts for hours like it’s your full-time job.

Signals typically rely on some mix of technical analysis (price patterns, momentum indicators, trend signals). Some providers add fundamental context (economic data, central bank expectations), but the majority of widely distributed signals are technical-first because it’s easier to standardize and automate.

The important part is not the hype around signals—it’s how they’re created, how you interpret them, and how you manage the risk when the market refuses to cooperate.

What Forex Trading Signals Actually Are

A forex trading signal usually includes:

  • Currency pair: Example: EUR/USD, GBP/JPY, USD/CHF
  • Trade direction: Buy (long) or Sell (short)
  • Entry level: Where you should consider opening or placing a pending order
  • Stop-loss (SL): The price level where you cut the trade if it goes wrong
  • Take-profit (TP) or exit guidance: A target level, sometimes more than one
  • Time horizon: Whether the signal is meant for minutes, hours, or days
  • Rationale: Often includes indicator readings or a short explanation of the setup

If a signal is just “BUY NOW” with no entry, stop-loss, or conditions, it’s basically a guess wrapped in a bow. Signals can be useful, but you should treat them like trading plans rather than magic spells.

Types of Forex Trading Signals

Forex signals differ in how they’re generated and how they’re delivered. Most traders run into two main categories right away. After that, it gets messy in the best possible way—because every provider has their own style.

1) Manual Signals

Manual signals are created by experienced traders or analysts who read the market using charting tools and discretionary judgment. They might spot chart patterns, confirm trends with oscillators, and apply rules learned from years of watching price behavior.

Because manual signals depend on human interpretation, they can reflect nuance. For example, a trader may ignore “almost perfect” indicator alignment if market structure doesn’t confirm the move. On the downside, manual signals can vary in consistency, especially when the trader changes strategies, gets overconfident, or simply has an off day.

Manual signals often come with a brief narrative: “price is bouncing from support, RSI shows momentum shift, wait for confirmation.” That explanation can help you learn something—even if you ultimately trade your own method.

2) Automated Signals

Automated signals are produced by trading algorithms, bots, or rule-based systems. The logic is typically predefined: when certain conditions occur, the system generates a buy or sell instruction.

Automated systems aim to remove emotional bias. They don’t get tired, they don’t “feel” like changing their mind mid-trade, and they can scan multiple pairs quickly. But rules-based systems also have limits: if market conditions shift (like increased volatility or a prolonged sideways range), a strategy that worked before may keep firing signals that don’t fit the new environment.

In other words, automation can be consistent, but consistent doesn’t always mean profitable.

3) Hybrid Signals (Human + Algorithm)

Some providers use a mix: an algorithm suggests setups, then a trader validates and adjusts them. You’ll often see short reasoning attached to the signal, but the “timing” might be driven by code. Hybrid approaches can reduce random mistakes while still adding discretionary judgment.

If you’re evaluating providers, hybrid signals can be appealing—but you should still verify performance and ask how rules are managed, what the system filters, and whether the provider follows risk controls.

Types by Strategy Style

Signals can also be categorized by the trading approach behind them. This matters because it affects the time horizon, the type of targets, and how you should manage price movement.

Common styles include:

  • Trend-following signals: Buy on pullbacks in an uptrend and sell on rallies in a downtrend.
  • Breakout signals: Trade when price moves beyond a support or resistance level with momentum.
  • Range or mean-reversion signals: Trade toward the middle of a range when price stretches too far.
  • Momentum signals: Use indicators like RSI or MACD to spot acceleration and reversals.
  • News-linked signals (less common in public feeds): Trade around events, volatility spikes, or rate expectations.

If your trading method doesn’t match the signal style, you’ll constantly feel like you’re late to the party—or early enough to miss the point. Matching the approach is half the battle.

How Forex Trading Signals Work

Execution of a forex signal typically follows a predictable workflow: gather market data, analyze it, generate a trade plan, then deliver it to the trader. Each step affects reliability.

1) Data Collection

The signal provider starts by collecting data about price action and sometimes rate-related information. Most technical signal providers pull data from:

  • Price candles (open, high, low, close)
  • Volume (not always reliable in FX retail feeds, but sometimes available)
  • Indicator inputs derived from price data

Technical indicators are common. The original article already mentions moving averages, MACD, and RSI, and these show up constantly:

  • Moving averages: Identify trend direction and dynamic support/resistance.
  • MACD: Measures momentum and trend strength using moving average convergence.
  • RSI: Indicates overbought/oversold conditions and momentum shifts.

These indicators aren’t crystal balls, but they’re useful signal tools when paired with proper entry and risk control.

2) Market Analysis

Once data is collected, the provider analyzes the market to forecast potential movement. Manual providers might look for chart structures like higher highs/higher lows, support and resistance zones, or specific candlestick behavior. Automated providers might use rule triggers such as “RSI crosses above 50” plus “MACD histogram increases” plus “price is above the 200 EMA.”

The analysis step determines how often signals are “in sync” with market structure. A trend-following signal fed into a range-bound market can lead to repeated stop-loss hits. Even good indicators can fail when the underlying market regime changes.

3) Signal Generation

After analysis, the provider generates the signal. A well-constructed signal includes trade direction plus levels. Typically, a signal contains:

  • Currency pair
  • Direction
  • Entry
  • Stop-loss
  • Take-profit targets

Some signals provide additional trade management guidance. For example, they may recommend moving stop-loss to break-even after price reaches a certain level, or they may suggest partial exits if TP1 is hit.

You should pay attention to whether the provider gives realistic levels or just guesses. Realistic levels align with recent swing highs/lows, not random numbers that look good on paper.

4) Signal Delivery

Signals reach traders via different channels. Email, SMS, and dedicated apps are common. Some providers offer real-time push notifications, while others post signals to a web platform.

Delivery speed matters most for short time horizon strategies (scalping or intraday). For swing trading signals with a multi-day window, delivery timing matters less, but your execution still needs to be timely enough to respect the entry conditions.

How to Use Forex Trading Signals

Using signals isn’t just about copying the trade. If you treat a signal like a checklist with no context, you’ll eventually get hurt. The market isn’t impressed by your commitment to the signal.

Choose a Reliable Provider

Selecting a provider is the first filter you should apply. Accuracy varies widely, and some providers are better at marketing than at trading. Start with basic verification:

  • Look for consistent historical performance, not cherry-picked results.
  • Check whether trades were taken according to the signal rules and whether slippage was considered.
  • Prefer providers that explain the strategy and show risk management.
  • Be cautious if results are shown only as screenshots without a trading journal or trackable data.

A provider with a long track record is not automatically profitable, but it’s usually a better starting point than a brand-new telegram channel promising 99% win rates. If something sounds too clean, it often is.

Understand the Signal Components

Before you place any order, understand what each parameter means. A signal with missing details is less useful than it appears.

At minimum, you should be able to answer these questions:

  • Where am I entering? Is it a limit order or market entry?
  • Where am I wrong? That’s the stop-loss.
  • Where am I expecting to be right? That’s the take-profit.
  • How long do I give the market? That’s the time horizon and expected duration.

If you don’t understand why stop-loss is where it is, you’re essentially borrowing someone else’s risk thinking. That can work temporarily, but it won’t teach you how to adapt.

Confirm with Personal Analysis

Signals can speed up decision-making, but they shouldn’t replace your trading plan. Even a quick confirmation matters:

  • Does the signal direction match the broader trend on a higher timeframe?
  • Are the entry and stop-loss placed near logical technical levels?
  • Does the setup align with recent market structure (swing points, breakouts, or range boundaries)?

This doesn’t mean you need to overanalyze. A basic check can catch obvious mismatches, like a sell signal issued into strong upward momentum across multiple timeframes.

Practice Risk Management

Risk management is where most retail traders win or lose, not with indicators. Even high-performing signal providers produce losing trades—because no method is correct all the time.

When you use signals, risk management should include:

  • Using stop-loss exactly as specified (unless you have a strong reason and a controlled plan to adjust it).
  • Limiting position size so a stop-loss doesn’t blow up your account.
  • Controlling leverage to match your ability to tolerate volatility.
  • Avoiding revenge trading after a stop-loss—signals aren’t obligated to “fix” your emotions.

It’s useful to treat signals as probabilities, not certainties. A string of losses can happen even in a strong system, especially during shifting market conditions.

Execution Details Matter More Than People Admit

Many traders fail at execution. They see a signal, but they place the order too late or enter at a different price than the one provided. With spreads and slippage, especially during news events, the actual entry can land outside the intended setup.

If a signal provides a specific entry level, consider whether:

  • your broker’s pricing matches the provider’s reference chart
  • spreads widen around the time of the trade
  • your order type (limit vs market) matches the provider’s plan

Small differences in execution can turn a good trade into a mediocre one. And if you’re trading frequently, those “small differences” pile up.

Common Mistakes When Using Forex Trading Signals

Signals are helpful, but traders tend to misuse them in predictable ways. Here are the mistakes that show up again and again.

Copying Without Context

Some traders copy signals blindly even when their own market view contradicts it. A signal can be correct relative to its strategy rules, but still fail if you’re using a different timeframe context or you ignore broader conditions like major support breakdowns.

Ignoring the Time Horizon

A signal meant for a 24–72 hour move can look “wrong” for the first couple of hours. If you panic and exit early, you turn a trade that should be managed into a trade that’s constantly interrupted.

On the other hand, if you hold an intraday signal for days, you’re no longer trading the same plan. Time horizon is part of the contract—whether you signed it or not.

Using Too Much Leverage

Signals may include stop-loss levels, but they can’t control your account risk. If you size trades too aggressively, normal market noise can hit your stop before the setup plays out.

In FX, leverage can be a tool, but it can also be a fast lane to blowing up a small account. Risk sizing is boring. It’s also effective.

Switching Providers Constantly

Changing providers every week is a common habit. Each new provider claims better performance, but your trading record resets every time you move. You end up chasing claims instead of measuring a consistent strategy.

At minimum, give a provider enough sample size. A handful of trades isn’t “proof.” It’s a rumor with receipts.

Evaluating Signal Quality: What to Look For

If you want to be serious about using signals, evaluate them like a trader would evaluate a strategy. Here’s how to do that without getting lost in spreadsheet hell.

1) Performance Consistency, Not Just Win Rate

High win rates can be misleading if losing trades are much bigger than winning trades. Look at the relationship between average win and average loss. A system with lower win rate can still be profitable if it cuts losses tightly and lets winners run.

2) Risk/Reward Fit

Many signals include take-profit levels. Check whether the TP is realistic relative to stop-loss distance. If TP is always far away and stop-loss is always close, you need a strategy that produces large enough follow-through to justify it.

3) Clear Rules and Strategy Notes

Providers that explain their approach tend to be easier to verify. If a provider can’t describe the logic behind their signals, you should assume the strategy is hard to replicate and hard to audit.

4) Trade History Transparency

Even if the provider is good, you should still verify details. Trade journal data, timestamps, and consistent pair naming matter. If the provider uses chart screenshots, ask for additional evidence of performance over time.

5) Drawdown Behavior

Profit is great. Drawdown is what tests your psychology and account survival. Your next trade matters when your previous trade was a loss. A provider that performs well but causes brutal drawdowns might still fail your account constraints.

How to Incorporate Signals Into a Trading Plan

If you use signals, you need a structure so the signal isn’t just “random trade prompts.” One practical approach is to define a rules-based method around the signals.

Step 1: Determine Your Trading Style Match

Check whether the signal provider’s time horizon matches your schedule. If you work a day job and can’t monitor trades, intraday signals with tight windows can be annoying in the most expensive way.

Swing trading signals often suit people who want fewer decisions per day and more time to manage positions (even if the market still finds new ways to surprise you).

Step 2: Use Higher Timeframes for Sanity Checks

You can keep it simple: use a higher timeframe trend filter (for example, daily direction) and allow only signals aligned with that bias. This avoids taking every signal regardless of context.

It also reduces the emotional impact when a signal suggests a trade that feels wrong in your gut.

Step 3: Decide When You Will Override

You don’t have to follow every signal tweak-free. But you should define override conditions ahead of time. For instance:

  • You only take signals if stop-loss location aligns with recent swing structure.
  • You avoid trading around major scheduled news if your market access widens spreads.
  • You reduce size when signals conflict with your higher timeframe bias.

Overriding isn’t wrong. It’s wrong when you override because you “feel like it.” A plan makes it disciplined.

Real-World Use Cases: When Signals Help

Signals aren’t only for beginners. Even experienced traders use them as time-savers or as a way to spot setups they might miss during busy hours.

Use Case 1: The Busy Trader Who Can’t Watch Charts All Day

Imagine someone who has a full work schedule and can’t track every 5-minute move. A swing-signal feed allows them to check trades a few times per day and manage positions with stop-loss and take-profit levels already set. It’s not glamorous, but it fits real life.

Use Case 2: The Learner Who Wants Feedback Loops

A newer trader may use signals to learn how others structure trade plans—especially stop-loss placement and target sizing. By comparing signal entries to their own analysis, they can understand why a setup is considered valid.

Just avoid the “I used a signal so I must be profitable” mindset. Use signals as an educational input, then build your own evaluation system.

Use Case 3: The Team Approach

Some traders run signal reviews in a team setting. One person monitors broader trends, another reviews signal logic, and a third handles execution. Even though this isn’t always possible for retail traders, small-scale version—like having one person sanity-check trade direction—can reduce mistakes.

Risk Management Beyond Stop-Loss

Stop-loss is necessary, but not sufficient. Risk management also includes the things you do before the stop-loss is even touched.

Position Sizing

Position sizing determines how much you lose if the stop-loss triggers. If you don’t size positions properly, even a “correct” signal can still ruin your account.

A typical approach is to risk a fixed percentage of account equity per trade. Keep the percentage small enough that a losing streak doesn’t destroy your momentum.

Correlation and Exposure

Forex signals often involve multiple pairs that are correlated. For example, buying EUR/USD and GBP/USD can expose you to overlapping dollar-related risk. If multiple signals fire in related pairs, your total exposure can exceed what you planned.

This is why it’s worth checking whether signals are effectively part of one bigger bet.

Trading During High-Volatility Periods

Some signals will be issued around times when volatility is expected—like major economic releases. If your broker spreads widen during these events, your execution can slip.

You don’t have to avoid news entirely. But you should know when volatility rises and adjust size or timing accordingly.

Do Forex Trading Signals Guarantee Profit?

No. Signals can reduce the time you spend analyzing. They can also provide structure and risk parameters. But no one can guarantee profit in FX because markets shift, liquidity changes, and price behavior adapts to new information.

A reputable signal provider should not promise certainty. If a provider guarantees gains, treat it as a marketing tactic. The market will collect on bad promises.

How to Spot Red Flags in Signal Providers

Most traders don’t fail because they “didn’t understand indicators.” They fail because they didn’t understand incentives.

Here are warning signs you should be aware of:

  • Claims of extremely high win rates without showing consistent history over time.
  • No risk management details or inconsistent stop-loss usage.
  • Signals missing entry/SL/TP or changing after the fact.
  • Only promotional content with no strategy explanation.
  • Pressure to subscribe quickly or pay for “VIP access” with vague results.

If you’re paying for signals, you’re buying a process. The process should be explainable and verifiable as much as possible.

Building Your Own Judgment Alongside Signals

Signals work best when they reinforce your decision-making rather than replace it. Over time, you can gradually shift from “follow signals” to “use signals for ideas” while you apply your own filter.

A practical way to do this is to keep a simple trading journal with three notes per trade: whether you followed the signal exactly, whether your confirmation matched, and how execution compared to the signal levels. You don’t need fancy analytics. You just need patterns.

After a few weeks, you’ll see what kinds of setups you accept well and which ones you reject even if they look good in hindsight.

Conclusion

Forex trading signals can be a useful resource for traders who want faster decision-making in the FX market. They may indicate potential buy or sell opportunities and often include entry, stop-loss, and target levels derived from technical and sometimes fundamental analysis. But signals are not a substitute for due diligence.

If you want the odds to improve, pick a provider carefully, understand every part of the signal, confirm with your own analysis, and practice risk management that fits your account size and time availability. With that approach, signals become less like guesswork and more like structured input into your trading process.

For those who want further insight into forex trading signals, focusing on reliable educational resources and consistent evaluation habits can improve results over time. When you treat signals as data you can test rather than promises you must trust, trading becomes a little less mysterious—and a little more manageable.

How to Trade News Events in the Forex Market

How to Trade News Events in the Forex Market

Understanding News Events in Forex Trading

Forex trading on news events isn’t some mystical “future sight” trick. It’s closer to how markets actually work in real time: big releases change expectations, expectations change positions, and positions change price. In the foreign exchange market, traders react to economic updates, central bank signals, and geopolitical headlines that can move currency pairs within minutes.

If you’ve traded forex for any length of time, you’ve probably seen it: the chart looks calm, then a release hits, and suddenly candles appear that look like they were drawn with a marker. The difference between traders who profit from those moments and traders who just donate money to spread costs is usually preparation and process. That’s what this guide focuses on—how to understand the news events that matter, what strategies are commonly used, and how to manage the risks when volatility arrives like it has somewhere to be.

Why News Moves Forex So Fast

Currency markets are forward-looking. Interest rates, inflation expectations, growth forecasts, and risk sentiment all shape what traders believe about the relative value of currencies. When new information contradicts (or confirms) those beliefs, pricing adjusts quickly.

There are a few reasons forex reacts fast to news:

1) Expectations matter more than the raw numbers. It’s common to see a “good” number still cause a currency to fall (because it was less good than expected).
2) Leverage amplifies moves. Many traders use margin, so a fast repricing can trigger stop-losses and margin calls across multiple accounts.
3) Liquidity shifts around major releases. Spreads can widen briefly, slippage becomes more likely, and execution quality matters.

So yes, the news itself matters. But how traders interpret it—relative to forecasts and prior communication—matters just as much.

Types of News Events Affecting Forex

Most forex “news trading” revolves around two big categories: economic data releases and geopolitical events. A third category—central bank communication—often overlaps with economic releases but deserves its own mention because speeches, minutes, and guidance can move markets even when no hard data prints.

Economic Data Releases

These are the scheduled releases coming from ministries, statistical agencies, and central banks. They include employment reports, inflation prints, GDP, trade balance data, retail sales, manufacturing surveys, and more.

Economic releases can be divided into “high-impact” and “medium-impact” groups, depending on how often traders and algorithms react. High-impact releases tend to have clear links to interest rates and growth expectations, which directly influence currency valuation.

Common examples include:

Non-Farm Payrolls (NFP) for the US labor market
Inflation reports such as CPI (consumer price index) or PCE (personal consumption expenditures)
Central bank rate decisions and related statements
GDP reports and growth forecasts
Employment and wage data beyond NFP, such as average earnings

When the actual result beats expectations, the currency often benefits because it suggests stronger growth or hotter inflation, which can lead to expectations of higher interest rates or fewer cuts. When the result disappoints, the opposite may occur.

One detail that’s easy to miss: “better than expected” can still be negative for a currency if the prior market positioning assumed an even better outcome.

Non-Farm Payrolls (NFP) as a Case Study

The Non-Farm Payrolls (NFP) report is one of the most influential economic indicators in forex. Released monthly in the US, it measures the number of employed people excluding agriculture (hence “non-farm”). Traders pay attention to:

The headline payrolls figure (jobs created)
Unemployment rate (labor market slack)
Average hourly earnings (wage pressure, inflation link)
Prior month revisions (sometimes the real story is what changes from earlier data)

A stronger-than-expected NFP often increases confidence in the US economy. That can strengthen the US dollar if traders also expect the Federal Reserve to keep policy tighter for longer. But if wage growth is weak even while payrolls are strong, the reaction might be muted or short-lived. Forex traders, like cats, react more to what moves their assumptions than to what “sounds” bullish.

Inflation Reports and Interest Rate Expectations

Inflation is a direct driver of central bank policy. If prices rise faster than expected, central banks may hesitate to cut rates or may even signal a need for further tightening. That interest-rate expectation typically strengthens the currency.

Inflation reports influence forex through several channels:

Short-term policy reaction: “Should the central bank act now?”
Longer-term expectation: “What will the future rate path look like?”
Risk sentiment: persistent inflation can raise uncertainty about growth and market stability

In other words, inflation data doesn’t just tell you prices today. It tells traders what might happen to rates tomorrow, and rates are the heartbeat of currency valuation.

Geopolitical Events

Geopolitical events include elections, political instability, legislative gridlock, sanctions, conflicts, and major diplomatic developments. These events can influence forex through:

Risk sentiment: how comfortable investors feel holding riskier assets
Safe-haven flows: movement to currencies perceived as stable
Trade routes and energy prices: which can affect inflation and growth
Sanctions and capital controls: which can directly impact economies and cross-border flows

Elections are a common example. Before election outcomes, markets may hedge their positions as uncertainty rises. After the result, the currency might move sharply if investors believe policy direction will shift fiscal spending, regulation, or alignment with trade partners.

International conflict can also drive safe-haven demand. Traders often move funds toward perceived safety—commonly currencies like the US dollar or Swiss franc—depending on the specific context and broader market conditions.

Central Bank Communication

Even without a scheduled economic release, central bank communication can move forex. Statements, minutes, speeches, and the wording of policy decisions can change interest rate expectations.

For example, a rate decision may be “as expected,” but the language might shift from neutral to hawkish (more likely to keep rates higher). That change can still create a tradable move.

This is where many traders get burned—because the number printed wasn’t surprising, but the guidance was. In forex, guidance is basically the market’s favorite kind of “what if.”

Strategies for Trading News Events

Trading on news events is mostly about aligning your trade plan with what news typically does to price. You don’t need a crystal ball. You need a framework: which releases matter, what “success” looks like, and how you control risk when the market does what it does best—surprises.

There are two broad styles: short-term strategies that aim to capture immediate volatility, and long-term strategies that aim to position for economic implications.

Short-Term Strategies

Short-term strategies focus on the immediate reaction after a news release. The trade lifespan can be minutes or even seconds, depending on liquidity and how quickly price moves. This style requires fast decision-making and an acceptance that slippage happens. If you can’t handle that, news scalping can feel like trying to shave with a bicycle chain. Messy.

Volatility Breakout Strategy: This strategy aims to profit from sudden price movement following a news event. Traders often plan entry and exit levels using recent volatility, previous highs/lows, or predefined pip distances.

Typical flow looks like this:

– Identify the major release and expected volatility window
– Place conditional orders or plan manual entries once price breaks a level
– Use tight risk controls because the initial move can fade quickly

A breakout trade works best when the news meaningfully changes expectations rather than just nudging them. If the market expected one thing and receives another clearly different result, breakouts are more likely to have follow-through.

Straddle Strategy: A straddle tries to capture the direction of a major move without guessing which way it will go. Traders place buy and sell stop orders on opposite sides of the current price, positioned above and below it. Once price breaks out, one side triggers and the other side typically remains inactive.

This is commonly used ahead of scheduled high-impact releases because the market often “chooses a direction” after the numbers land. If it moves sharply upward, the buy stop triggers; if it drops, the sell stop triggers.

It’s not magic, though. The biggest risks are:

– Spreads and execution slippage during the announcement
– The move triggers, then reverses (whipsaw)
– One side triggers too close to the noise, not the trend

So straddles can be effective, but your order placement and risk settings matter more than optimism.

Long-Term Strategies

Long-term news strategies are less about the first spike on the chart and more about what the news changes in expectations over weeks and months. If short-term trading is reacting to a loud signal, long-term trading is positioning for a policy shift or sustained economic trend.

Fundamental Analysis: In fundamental analysis, traders interpret what news means for future economic conditions and policy rates. For example, if employment and inflation data consistently point toward higher rates, traders may prefer that currency over time.

With central bank policy, the logic is straightforward even if it’s not always pleasant:

– Higher expected interest rates attract capital
– Capital inflows support the currency
– Stronger growth and controlled inflation reinforce that view

However, interpretation matters. A country can post strong growth but still face future rate cuts if inflation is cooling or political pressure increases. So traders often look beyond the headline and compare multiple indicators.

In practice, traders might track:

– Inflation trends versus central bank targets
– Wage growth versus productivity
– Market pricing of interest rate changes (as reflected in futures or implied yield measures)
– Consistency across releases rather than a single print

Position Trading: Position trading takes fewer trades and holds them longer. The objective is to profit from larger shifts in currency valuation tied to economic news, often including:

– sustained interest rate divergence
– persistent inflation or growth trends
– longer-term geopolitical developments affecting risk and investment

For example, if a sequence of releases keeps pushing a central bank toward tighter policy, traders may hold a long position on that currency for weeks or months. The trade plan usually depends on the difference between “policy expectations” and “market expectations” at the time of entry.

Position trading can feel calmer than news scalping, but it still has its own way of humiliating people: if your thesis is wrong, the market doesn’t care that you’re “waiting for it to come back.” So discipline and risk controls still matter.

Managing Risks Associated with News Trading

News trading is popular for a reason: volatility can create opportunity. It’s also popular for a reason that’s less fun: volatility can wipe out inexperienced accounts quickly. Risk management isn’t optional here. It’s the seatbelt.

Setting Stop-Loss Orders

Stop-loss orders limit losses if the market moves against you. In news trading, stops are especially important because price can gap, whip, and overshoot. A well-placed stop can prevent “one bad minute” from becoming “one bad month.”

Key considerations for stop-losses during news:

Use realistic stop distances: stops too tight can be hit by normal volatility. Stops too wide can make the loss too large relative to your account.
Expect spread widening and slippage: your stop may execute at a slightly worse price than the level you set.
Know your invalidation level: your stop should align with when your thesis is wrong, not where you hope price will go.

For example, if you trade an inflation surprise expecting hawkish repricing, your thesis might be invalidated if price moves against you and holds. That’s when you accept the loss rather than arguing with the market.

Using Proper Leverage

Leverage can turn small price moves into outsized gains—but it can also create outsized losses when volatility hits. During major announcements, currency pairs can move far more than your broker’s “normal” assumption for spread and execution quality.

A practical approach is to match leverage to your ability to tolerate swings. Traders often underestimate how much volatility compounds with leverage. If you use high leverage for calmer markets, you’ll likely reduce position size for news trading.

Some traders do the simplest thing: lower the trade size around major releases. Even if your strategy is right, the market can still move through your stop before deciding to reverse.

If you want a rule of thumb (not a guarantee), treat news windows as moments when position size needs discipline more than bravery.

Choosing the Right Trading Window

Not every moment around a news release is equally tradable. Price behavior changes depending on:

– the exact time of release
– the initial reaction versus subsequent repricing
– liquidity conditions
– what other correlated releases hit around the same time

Many traders prefer to avoid placing orders far outside the announcement moment. Others place orders, but only after confirming something—like direction from broader market context—or after the first spike stabilizes.

The wrong approach is “set it and forget it” when your plan depends on execution quality. News can move quickly enough that your “set” becomes just a delayed regret.

Planning for Whipsaws and False Breakouts

Whipsaw is when the market moves sharply in one direction and then reverses. It’s common in news trading because:

– the first move reflects the immediate interpretation
– additional market participants adjust positioning afterwards
– traders react to revisions, not just the initial figure
– implied expectations were different than the one-line forecast

To reduce the damage, traders often:

– take partial profits early
– move stops to reduce risk after a move has proven itself
– avoid entering late once price has already traveled far

Whipsaws don’t mean your strategy is broken. They mean you need better entry timing, clearer risk rules, or both.

Building a News Trading Workflow (What to Do Before the Market Reacts)

Most people don’t lose money because they lack intelligence. They lose it because the process is missing. News trading forces a workflow. Here’s what that workflow usually includes.

1) Identify Which Releases Actually Matter to Your Pairs

You trade currency pairs, so you care about releases tied to those countries’ economies. A US-focused trader naturally prioritizes US data for USD pairs. Similarly, EUR traders focus on eurozone indicators and ECB communications.

This sounds obvious, but many traders keep a generic “economic calendar” habit and react to whatever is trending online. That’s how you end up trading the wrong news for the wrong pair at the worst time.

2) Compare Actual Results to Expectations, Not Headlines

Expectations are embedded in price already. The market often moves when the actual print differs from what traders priced in.

So instead of asking “was it good or bad?” your checklist becomes:

– Did it beat the forecast?
– By how much?
– Did the report include components that matter for inflation or policy?
– Did the revision change the story?

A small beat might not move much. A large divergence can move markets dramatically. And sometimes the “beat” triggers a sell because it implies policy tightening faster than traders anticipated.

3) Check the Market’s Rate Expectations

Even if you don’t trade interest rate products, you can still think in terms of rate expectations. Market pricing often reflects the idea that central banks respond to inflation and growth. So you want to know what traders already believe about the future rate path.

If the news confirms the market expectation, the reaction may fade. If it contradicts it, volatility often persists longer.

4) Decide Your Trade Plan Before the Release

This is where many traders fail: they decide after the candle appears. By then, spreads, emotion, and execution quality have already joined the party.

A real plan usually includes:

– your entry method (conditional orders, breakout level, or manual entry timing)
– your stop-loss logic (where invalidation happens)
– your target approach (fixed, partial exits, or “trend continuation” style)
– your maximum loss per trade

News trading doesn’t forgive improvisation. The market is too fast and your average human reaction time just isn’t.

Common News Trading Mistakes

If you’ve ever watched a news release unfold and thought “I swear I was right,” you’ve probably made at least one of these mistakes.

Mistake 1: Trading Every Headline

Not every headline is market-moving. Some announcements carry low impact or are expected in advance. When you trade too many releases, your risk exposure increases and your hit-rate often drops.

Better approach: trade fewer events, but trade them with preparation.

Mistake 2: Ignoring the Details (Wages, Core Inflation, Revisions)

Headlines can be misleading. A jobs report is more than payroll counts. Wage growth can change the inflation outlook. Inflation reports often have “core” measures that exclude certain components. Revisions can change the narrative to match or contradict earlier prints.

If you ignore these details, you end up responding to noise rather than information.

Mistake 3: Overconfidence After a Big First Move

Many traders enter on the first direction and then panic when the market retraces. But the first move is often the market reacting to the initial interpretation. Sometimes a second wave reprices the trade once more participants digest the full content of the release.

That’s why patience—or at least a flexible exit plan—is valuable. Sometimes the best trade management is “hold for confirmation” rather than “assume the first candle is the final verdict.”

Mistake 4: Unrealistic Stops and Position Size

Stops that are too close during news tend to get hit even if your thesis is correct. Position sizing that is too large creates forced exits due to leverage effects—not because you were wrong, but because you’re overextended for the volatility.

Your goal is survival first. Profit is what happens after survival.

How to Use an Economic Calendar Without Becoming a Full-Time Meteorologist

Economic calendars are essential for news trading. But there’s a difference between using one and living inside it.

A practical use pattern:

– mark the releases that impact your traded currencies
– note the “high-impact” events and expected forecasts
– confirm time zones and your broker server time
– plan what you’ll do in the first minutes after the release

When the market hits, you don’t want to spend your attention figuring out whether the event already passed. You want to execute the plan you wrote while you still had a pulse and free will.

Putting It Together: Example Scenarios

To make this less abstract, here are a few realistic scenarios that explain how news trading often behaves.

Scenario A: NFP Beats Forecast, Wages Also Rise

Assume US NFP comes in stronger than forecast, and average hourly earnings are also higher than expected. That combination tends to push expectations for stronger inflation pressure and tighter policy. Many traders look for USD strength across major pairs.

A short-term breakout trader might place conditional orders around relevant resistance/support levels and trade the first direction if breakouts confirm. A longer-term trader might build a position expecting sustained rate divergence.

Scenario B: Inflation Drops More Than Expected, But Growth Is Still Strong

If inflation surprises lower, central bank pressure to keep rates high may ease. But if growth is still strong, the currency reaction might be mixed. The market might not fully “sell” the currency if growth keeps policy from turning too dovish.

That’s why traders compare multiple components, not just the headline inflation number.

Scenario C: Political Uncertainty Increases Ahead of an Election

In some cases, the market reacts more to uncertainty than to policy details. Risk sentiment can drive investors toward safe-haven currencies. If the election results later reduce uncertainty, the currency might rebound sharply as hedging unwinds.

News traders watch for the difference between “fear pricing” and “new information pricing.” Those aren’t always the same.

Conclusion

Trading forex based on news events offers opportunities for both short-term and long-term gains, but it demands disciplined preparation and risk management. You’ll do better when you treat news as a change in expectations rather than a scoreboard of good and bad numbers. Economic indicators like NFP and inflation reports can reshape central bank expectations. Geopolitical events can shift risk sentiment and safe-haven demand. Central bank communication can move markets even when data seems “fine.”

If you want to keep your situational awareness strong, it helps to use a consistent feed for schedules and analysis such as Forex Factory or DailyFX. Being aware of the economic calendar and anticipating what might move your chosen pairs lets you plan trades ahead of time rather than reacting while the spread is widening.

Effective news trading still comes down to execution, emotional control, and a workflow you can repeat under pressure. When you handle those parts well, volatility stops being a random punch to the face and starts behaving like what it is: tradable market behavior.

The Importance of Trading Psychology in Forex Success

The Importance of Trading Psychology in Forex Success

The Role of Trading Psychology in Forex Success

Forex trading is not only about charts, indicators, and macroeconomic headlines. You can have a solid strategy and still bleed money because your brain starts bargaining with you at the worst possible moment—right when your plan is supposed to run the show. Trading psychology is the part of the process that explains why two traders can see the same setup and produce wildly different outcomes.

In other words: the market doesn’t change because you feel nervous. But your decisions do. When traders learn to manage emotions, improve self-control, and build repeatable habits, their performance usually becomes more consistent. This article focuses on the mental mechanics behind trading decisions—what goes wrong, why it happens, and how to fix it without turning your trading life into a 24/7 mindfulness seminar.

Understanding Trading Psychology

Trading psychology refers to the emotional and mental state that shapes your decision-making. It includes how you interpret uncertainty, handle losses, react to wins, cope with drawdowns, and follow your own rules. Market conditions may be chaotic, but your internal conditions can be chaotic too—and that’s often the real problem.

At the center are emotions like fear, greed, frustration, and anxiety. These aren’t “bad” in a moral sense; they’re just signals your brain produces under stress. The danger comes when emotion starts overriding your strategy. A trader who can recognize the emotion quickly can still act, but in a way that matches the plan rather than the mood.

There’s also a mental layer that sits underneath emotion: beliefs about your ability, your confidence in the system, and your expectations of what “should” happen. For example, if you assume you’re due for a win after a losing streak, you may start taking trades that don’t match your criteria. If you believe losses mean you’re doing something wrong, you may hesitate to cut positions that should be closed. Psychology isn’t just about feelings; it’s about assumptions that determine behavior.

What Psychology Does to Decision-Making

Your trading decisions usually come from a process that looks like this: you see information, interpret it, decide, execute, and then evaluate. Trading psychology affects the interpretation and evaluation steps the most.

When you’re calm, you tend to interpret setups based on structure and probabilities. When you’re stressed, your brain shifts toward threat detection—what can go wrong—and you may overweight negative outcomes. After a loss, many traders interpret the same market differently, even when nothing materially changed.

When you win, the brain often does something else: it assigns the win to your skill and the loss to randomness. That’s fine as a temporary story, but it becomes dangerous when it leads to increased risk or sloppy execution. Eventually, your behavior drifts and your results follow.

Emotions Are Useful Data—Until They Aren’t

Emotion can be a source of valuable insights. For example, fear before entry might be your brain detecting that you’re forcing a trade, that liquidity is thin, or that the setup is less clean than you want to admit. Greed can sometimes show up when the reward-to-risk looks unusually good, and your brain latches onto easy profit thinking.

But here’s the catch: emotions are noisy. Your job isn’t to obey them. Your job is to interpret them like a dashboard light. When you feel an emotion, you ask a simple question: “Is this a warning that my trade doesn’t match my plan?” If the answer is yes, you pause. If the answer is no, you execute according to your rules even if your stomach feels like it’s filled with unsweetened coffee.

Common Psychological Pitfalls

Most psychological issues in forex trading fall into a handful of buckets. You don’t need to “fix your personality.” You need to recognize the patterns and stop feeding them.

Overconfidence is one of the most frequent problems. It often appears after a string of wins, when your confidence spikes and your risk management loosens. This can happen subtly. A trader might start increasing lot size, skipping a portion of the analysis, or taking trades that are slightly outside the original strategy because “it’s basically the same.” Overconfidence creates a blind spot: the trader starts believing they’ve mastered the market’s behavior when they’ve only mastered a short sample of outcomes.

Fear is the flip side. Fear can prevent traders from entering trades that meet their criteria. Instead of waiting for a proper setup, they wait for emotional comfort. The problem is that emotions rarely provide accurate timing. A “safe feeling” does not equal an edge. Fear also causes premature exits, especially when a trade goes into drawdown and the trader decides the market is “definitely reversing.” Sometimes it is. Often it isn’t—and the trader just paid a tuition fee to a market that doesn’t care.

Inability to accept losses can lead to holding losing positions longer than necessary. This is driven by hope: the belief that the price will come back to your entry just because you want it to. Traders get stuck in what looks like patience but behaves like denial. The hope-despair cycle describes the emotional oscillation between optimism and disappointment. You expect recovery, you see it almost happen, you feel relief, and then the market moves against you again. Each swing makes it harder to act rationally.

Revenge trading follows that cycle. After a loss, the trader wants to “win it back” quickly, which turns trading into a reaction instead of a strategy. Revenge trading tends to reduce discipline: you enter faster, justify questionable setups, and abandon the risk plan because you’re trying to fix an emotional problem with money.

Chasing and late entries are another issue. When price moves without you, you feel like you missed the boat. So you jump in after the move has already happened. In many strategies, late entries carry worse structure and higher risk. Psychology makes you pay the “missed opportunity tax” with your account balance.

Results-thinking also causes damage. Some traders evaluate their strategy based on profit alone instead of process. If a trade loses but followed rules, it still has value as data. If a trade wins but violated rules, it may tempt you to keep the violations going. Results-thinking turns your trading plan into a hostage situation: the market controls your confidence rather than your process.

Strategies to Manage Trading Psychology

The good news is that trading psychology is trainable. Not in the “be positive and everything works out” way. Trainable in the “change your inputs and your behavior will follow” way. You can build structure around decisions so your emotions have less room to hijack the plan.

Build a Trading Plan You Can Actually Follow

A trading plan reduces emotional decision-making by forcing you to follow rules during both calm and stressful moments. It should cover what you trade, why you trade it, when you enter, when you exit, and how you size risk.

Most plans fail for one boring reason: they’re too vague. “Buy when the trend is strong” is not a plan. “Buy EURUSD on a daily trend alignment with a defined trigger, place a stop based on swing structure, and risk 1% per trade” is closer to something you can execute without improvising like a jazz musician.

When your plan is specific enough, you can treat your emotions as an alert system instead of a boss. If the setup exists, you can enter. If it doesn’t, you wait—even if waiting feels like losing time.

Use Risk Management as Emotional Management

Risk management isn’t just for math. It’s for your mindset. If position sizing is capped and consistent, losses become less personal. They become measurable outcomes within a process.

When traders ignore risk limits, every loss becomes a bigger psychological event. That increases the likelihood of revenge trading, overcorrection, or “I’ll just risk more to recover faster.” A good risk system keeps the account from turning every minor mistake into a crisis.

A simple way to think about it: if your risk per trade is reasonable, your brain has less reason to panic. It’s harder to feel helpless when your plan limits damage.

Maintain a Trading Journal That Captures Emotions, Not Just P/L

A trading journal helps in two ways. First, it turns your trading history into pattern data you can review. Second, it captures the emotional context that production systems often miss.

Instead of only recording entry, exit, and results, log a short note about your mental state and the situation before you traded. For example:

  • “Felt rushed; entry was earlier than planned.”
  • “Felt confident after prior wins; increased size.”
  • “Felt fear during drawdown; moved stop further than planned.”

Over time you’ll begin to see correlations between emotions and behavior. Many traders discover they don’t have a strategy problem—they have a trigger problem. Maybe the real pattern is entering impulsively after a news spike, or exiting too early when you’re up but not at the take-profit level. The journal gives you evidence rather than guesses.

It also helps to track what you did right, not only what you did wrong. If you never record wins as part of the process, you’ll forget what discipline looked like when it was working.

Practice Pre-Trade and Post-Trade Checklists

Checklists are underrated because they feel “robotic.” That’s the point. You want to reduce room for improvisation. A pre-trade checklist can include: “Does the setup match rules?” “Is the stop placed based on structure?” “Is risk within limit?” “Do I understand the exit conditions?”

A post-trade checklist can focus on behavior: “Did I follow the plan?” “Did I change anything emotionally?” “What did I learn?” That helps switch your brain from outcome chasing to process evaluation.

This is particularly useful during drawdowns. When your confidence drops, you stop trusting yourself. A checklist acts like a decision prosthetic—temporary, but helpful.

Maintain a Balanced Lifestyle to Reduce Stress Effects

A balanced lifestyle supports better decision-making. Regular exercise and adequate rest improve stress tolerance. That matters because trading stress can be cumulative. If you’re constantly short on sleep, your patience shrinks. Your tolerance for uncertainty drops. You may interpret normal price fluctuation as a threat rather than background noise.

Relaxation techniques—breathing exercises, meditation, walking, or even turning music on while reviewing charts—often help, but the main goal is consistency. Traders who train their routines usually trade with fewer emotional spikes than traders who only manage stress when things go wrong.

Also, watch the “life distraction tax.” Long workdays, family stress, and poor eating habits show up in your charts as haste and impatience. Not glamorous, but common.

The Impact of Mindset on Trading Performance

Skill matters, but mindset shapes how you use that skill. It influences whether you treat trading as learning or as judgment. It determines whether losses are treated as feedback or as proof that you’re failing.

A growth mindset is one of the most practical approaches. It means you focus on learning and improvement, not on proving your identity as a “great trader” or “not a trader.” With a growth mindset, losses don’t trigger shame. They trigger review. You ask: “What did I do? Was it within my rules? If not, what do I change?”

This style of thinking builds resilience. Forex markets can be brutal over short time periods, and resilience is not a personality trait you either have or don’t. It’s a response pattern you develop.

Emotional Intelligence: Knowing What You Feel and Why

Developing emotional intelligence helps you manage emotions without pretending they aren’t there. Emotional intelligence means you can identify what you’re feeling, trace it to the situation, and decide how to respond.

For example, a trader might feel “confused” during a trade. Emotional intelligence asks whether “confused” actually means “uncertain about plan execution,” or whether it’s code for “I don’t trust my stop,” or whether it’s “I’m seeing things that aren’t in the chart.” If you can label the feeling, you can address its cause.

This also helps with adaptation. Markets change. Your setups may degrade. A trader with higher emotional intelligence is more likely to pause and reassess rather than stubbornly apply a strategy after it stops performing.

Risk Perception and How It Drives Behavior

Mindset influences how you perceive risk. If you treat risk as a highlight reel—“risk is exciting”—you might ignore limits. If you treat risk as a controllable tool, you’ll size appropriately and stick to stops more consistently.

Many traders don’t lose money because they don’t know about stops. They lose because they relate to stops emotionally. A stop feels like a promise being broken, a signal that you “were wrong.” But your system should treat a stop as a tool, not a personal verdict. When your mindset supports that, decision quality improves and you reduce needless emotional interference.

Common Mindset Errors Traders Don’t Talk About

There are a few mindset mistakes that sound harmless until they show up in your trading account:

  • All-or-nothing thinking: “If I’m not up today, I failed.” That pushes revenge and activity bias.
  • Over-identification: “My strategy is me.” When the strategy produces losses, the personal ego gets bruised.
  • False certainty: “This time the market has to respect my level.” Markets don’t bargain.
  • Ignoring variance: Expecting smooth equity curves. Real trading includes periods of randomness and grind.

These beliefs shape behavior on both sides of the trade—entry decisions and exit decisions.

Psychology in Real Trading: What It Looks Like Day to Day

Let’s make this practical. Imagine a trader who has a decent system but struggles with discipline. The system looks good on paper. The charts often match entry criteria. But the trader’s emotional pattern repeatedly creates avoidable errors.

On a Tuesday morning, the setup appears. The trader likes the chart, but price is a touch extended from the entry point. The plan says “only enter at the trigger.” The trader feels impatient. Instead of waiting, they enter early, “just this once,” and the stop gets tagged. That loss doesn’t just hurt the account; it fuels the next day’s behavior.

On Wednesday, after a loss, they become risk-averse. They start skipping trades to avoid another stop-out. Then they chase a later move because they refuse to miss the opportunity again. The trade ends in a partial loss, but this time the trader also starts adjusting the stop “to give it room.” The emotional driver is fear of realizing the stop-out again.

Now the account is down, and the trader’s confidence is low. They start searching for a “stronger sign” that doesn’t exist. They overtrade until they find something worse than their original setup. It feels like desperation because, psychologically, it is.

This pattern is common. It’s not a sign that the strategy is worthless. It’s a sign that emotional triggers are changing behavior: overconfidence after wins (bigger size, looser criteria) and fear after losses (skip rules, move stops, revenge trades).

Tools and Techniques That Support Trading Discipline

Think in Rules, Not Feelings

One of the best ways to manage psychology is to convert it into rules your brain can follow under stress. Instead of “I’ll feel confident enough to enter,” you define “I enter only when X occurs.”

If you do that, the trading decision becomes a checklist verification rather than a mental debate. The market will still be unpredictable; your execution won’t be constantly negotiated.

Separate Trade Planning From Trade Execution

Many traders plan while emotionally engaged. They look at a setup, feel excited or worried, then execute immediately. When emotions spike, plan accuracy drops.

A cleaner method is to do planning with full attention, then execute without renegotiating. That might mean: mark the setup, set the order, and step away for a moment. Not because you’re scared of your own trade, but because you’re reducing the chance of “fixing” when nothing is broken.

Use Limits on Frequency When You’re Overstimulated

Trading psychology gets worse when you’re tired, bored, or overly focused. Some traders start charting constantly, hunting for setups that aren’t in the strategy. That’s when mistakes increase.

If you notice that pattern, create a rule: maximum number of trades per day, or maximum active analysis windows. That reduces the chance of impulsive entries.

Reframe Losses as Feedback

Losses feel personal when you interpret them as failure. But losses are part of any probabilistic system. Even good strategies experience losing streaks because markets are noisy and because probabilities don’t guarantee a straight line.

A useful reframe is: “This loss helps me locate where my process deviated.” If your process followed the plan, you learn about variance and market conditions. If it didn’t, you learn about your triggers. Either way, the loss becomes information rather than a verdict.

When You Should Pause Trading

There are times when trading psychology is telling you to step back. Those times don’t require drama. They require honest observation. If you’re unable to follow your rules, if you feel angry, if you keep checking price obsessively, or if you’re making “fixes” like moving stops without a rule—pause.

A pause can be an hour, a day, or longer. The point is to stop the behavior spiral. Many traders only pause after damage. Better to pause before the account takes a bigger hit.

How Long Does Trading Psychology Training Take?

There’s no fixed timeline, because it depends on how consistent you are with journaling, checklists, and plan execution. But you can expect changes to show up in a measurable way rather than a motivational way.

In practice, many traders notice improvement when they reduce rule violations. The first wins often come from preventing the obvious psychological mistakes: no revenge trading, no late entries, no “one more trade” after a loss, no random stop changes. Over time, you’ll likely become more consistent in execution even when emotional heat rises.

It’s tempting to want faster results. If you’re improving your process, it will feel slow. That’s because consistency usually grows from small corrections, not from one big breakthrough session.

Conclusion

Trading psychology is not a side topic. It’s the operating system behind your strategy. Even when your technical analysis is decent, emotions and beliefs shape how you enter, how you manage risk, and how you respond to losses and wins. That’s why traders who understand trading psychology often perform more consistently: they reduce rule violations and turn emotions into usable signals.

A trader who recognizes their psychological tendencies gains an advantage that charts can’t provide. They can harmonize emotion with strategy and keep decision-making aligned with the plan. The forex market will still move unpredictably. The difference is that your process stays intact.

For more insights into the world of forex trading, consider visiting reliable trading resources. Through continual learning and adaptation, traders can enhance their trading acumen and navigate the challenging yet rewarding terrain of the forex market.

Understanding Forex Slippage and How to Minimize It

Understanding Forex Slippage and How to Minimize It

Introduction to Forex Slippage

In forex trading, slippage shows up more often than most traders expect—usually on the day they swear they’re being careful. Slippage is the gap between the price you thought you were getting and the price your trade actually fills at. If you’ve ever placed an order expecting a clean entry and then watched the chart print a fill that’s a few pips worse, you’ve seen slippage in action.

While one trade won’t make or break your account, slippage becomes a real issue when you trade frequently, hold tight profit targets, or run automation that places orders at high speed. It’s also worth knowing that slippage doesn’t affect every broker equally. Different execution models and liquidity sources can change how often you get decent fills versus “surprise, here’s a worse price.”

What Slippage Looks Like in Real Trading

Slippage usually comes up in one of these scenarios:

When you place a market order (you accept the current price), but the market moves during order processing.
When liquidity thins out (fewer buyers/sellers), so your order can’t match at the intended level.
When volatility spikes (news releases, sudden geopolitical headlines), causing rapid price jumps.

A lot of traders describe it as “the broker changed the price.” More accurately, the market changed while your order was moving through the execution chain. Even the best systems can only execute against what’s available at the moment the request is processed.

What Causes Slippage?

Slippage is primarily caused by market volatility and liquidity. During highly volatile periods, such as after major news announcements, prices change rapidly, so trades can fill at prices different from those seen at order placement. Additionally, low liquidity in the market can cause slippage, because there may not be enough buyers or sellers at the specific price level your order needed.

Market Volatility

Market volatility refers to how quickly and sharply the price of a currency pair moves. In high-vol environments, a bid/ask can shift multiple times in a second, and your order may not lock onto the price you expected.

This is common around:

Major economic news releases (inflation, jobs reports, central bank decisions)
Geopolitical developments that alter risk sentiment
Unexpected policy statements that move interest-rate expectations

When volatility rises, the spread can widen too. The spread widening means even “normal” price moves start to feel more expensive.

Liquidity Levels

Liquidity is the availability of buyers and sellers at different price levels. With higher liquidity, trades match more easily, and fills are closer to the quoted price.

Low liquidity tends to show up when:

Trading occurs during off-market hours
You trade during thinner session overlaps
You trade less popular pairs that don’t have consistent participation
A broker routes orders to liquidity sources that are temporarily strained

If there aren’t enough counterparties at your intended price, the system has to fill closer to the next available level—which can be worse than expected.

Order Execution Speed and Technology

Even outside major news, slippage can occur due to execution timing. Your order has to pass through several steps: your platform sends an instruction, your broker receives it, routing chooses counterparties, and the execution platform confirms the fill.

If any part of this pipeline delays processing by milliseconds, the market can move a bit in the meantime. That may not matter in slow markets, but it matters in fast markets or for scalping strategies.

Types of Slippage

Slippage can be positive, negative, or zero.

Positive slippage occurs when the executed price is more favorable than the quoted price.
Negative slippage results in a less favorable price.
Zero slippage means the trade is executed exactly at the quoted price.

From a trader’s perspective, zero slippage is never guaranteed—especially when you’re using market orders. Still, understanding these categories matters because it helps you evaluate whether the average outcome is acceptable or if slippage is silently eating your edge.

Impact on Forex Trading

Forex slippage can affect traders of every experience level. The bigger the number of trades, the more slippage accumulates. That’s why the effect shows up loudly for:

Scalpers who target a few pips per trade
High-frequency systems (manual or automated) that place many orders
Traders using tight stop-loss and take-profit levels

When your strategy relies on consistent entry prices, slippage distorts probability. Even if your win rate stays similar, your average win and average loss sizes can change. A few extra pips on entry, and suddenly your risk/reward math looks less… math-y.

Automated trading systems and algorithms also need to be careful. Many of them assume an expected fill structure—especially if they test back in a simulator that doesn’t model real execution costs accurately. If slippage isn’t modeled (or is modeled poorly), the live results can drift.

Strategies to Minimize Forex Slippage

Slippage can’t be eliminated completely because it’s tied to how fast markets move and how orders get filled. But you can reduce how often it happens and how costly it is. Most slippage minimization comes down to three variables: execution quality, order type, and trading conditions.

Choose the Right Broker

Selecting a broker matters more than most traders admit. A broker’s execution model affects whether your orders get routed efficiently and how honestly slippage is reflected in reporting.

Some brokers use execution methods that can reduce the chance of worse fills, while others may show more variation. In general terms, brokers with Electronic Communication Network (ECN) accounts can offer more direct access to market participants and typically provide competitive execution speeds and less slippage. The basic idea is that your order interacts with a pool of liquidity providers rather than only going through a single internal path.

Before opening an account, it’s smart to:

Read the broker’s execution and slippage policy
Check how they define “market execution” for your account type
Look at spread behavior during volatile periods
Test on a demo account, then compare fills on a small live account

Also, don’t ignore the boring reading. “Market orders are executed at the best available price” is common wording and it sounds reassuring until you see how execution behaves during news.

Trade During Optimal Market Hours

Timing affects slippage because it changes liquidity and spread. Trading when the market is busiest tends to reduce the distance between quoted and executed prices.

The overlap between the London and New York sessions is often characterized by higher liquidity and usually less slippage. Meanwhile, the Asian session can be thinner depending on what pairs you trade, which can lead to wider spreads and more price jumps.

A practical approach is to track slippage patterns on your own account. If you notice consistently worse fills at certain hours, that’s useful information—even if the headline “best trading hours” chart says otherwise.

Utilize Limit Orders

When you have the choice, use limit orders rather than market orders.

Limit orders give you control over the price you’re willing to accept. The trade won’t fill unless the market reaches your limit price. This approach can reduce negative slippage because you’re not accepting “whatever next price is available.”

There’s a trade-off, of course. Limit orders can fail to fill, especially in fast markets where price jumps past your level. But for traders who care more about entry precision than guaranteed fills, limit orders are one of the simplest slippage controls.

Use Stop-Limit Orders (When Appropriate)

For strategies that depend on breakout or stop entries, consider stop-limit logic instead of plain stop-market orders. A stop-limit order activates at your stop level, but it only executes within your specified price range.

This can reduce extreme negative slippage during sudden spikes, because the system refuses to fill at a worse-than-acceptable price. The drawback is that it can miss the entry entirely during violent moves—again, not always a problem if your plan allows it.

Monitor Economic News

Economic news is one of the most predictable sources of slippage, even if it’s still not predictable in timing down to the millisecond.

Major announcements can cause sharp price movements, widened spreads, and sudden liquidity shifts. If you trade around news, slippage can spike simply because the market reprices quickly.

A common risk-management setup is:

Avoid new market entries shortly before and during high-impact releases
If you trade those times, use order types that reduce “worst fill” exposure (like limits)
Reduce position size during scheduled volatility, just so your account doesn’t do parkour

If you’re not sure which events matter, start with the high-impact categories: central bank rate decisions, CPI, jobs reports, and surprise statements.

Broker Execution Testing: A Practical Way to See Slippage

If you want to stop arguing with theory and look at reality, run a small execution test:

Take notes for a specific pair (for example EUR/USD) and a specific time window.
Place a set of market orders of the same size.
Compare expected quoted price vs actual fill price.
Log the difference in pips, and calculate the average and worst-case.

Do this for a normal session and a high-volatility session. You’ll quickly see whether your slippage problem is occasional and controllable, or structural.

Conclusion

Slippage is an unavoidable aspect of forex trading, but it doesn’t have to be a mystery tax that you keep paying. By understanding the causes—volatility and liquidity—and using practical controls like a solid broker choice, trading during liquid hours, and order types like limit orders, you can reduce slippage’s impact on your overall performance.

Most importantly, slippage management should be part of your strategy, not an afterthought you notice when your results look off. When execution conditions are factored in, your strategy becomes easier to trust, and your risk calculations stay closer to reality.

Through comprehension and adaptation, traders can better manage slippage and refine their approach to risk. Aligning trading practices with market conditions and broker capabilities improves consistency, even when the market is doing its usual best impression of a rollercoaster.

Slippage vs Spread: They’re Related, But Not the Same

Traders often mix up slippage and spread because both affect your execution cost. They’re connected—especially during volatility—but they describe different things.

Spread

Spread is the difference between the bid and the ask prices at any moment. It’s visible on your trading platform all the time. When volatility rises, spreads often widen, which immediately makes entries and exits more expensive.

Slippage

Slippage is the difference between the price you expect at order placement and the price you actually get at execution. It’s about movement between “send” and “fill.”

A simple way to remember it:
Spread is the cost you see.
Slippage is the cost you sometimes get.

During fast markets, you can experience both: spreads widen and price moves between your quote and fill. That combination tends to hit especially hard for short-horizon strategies.

How Slippage Affects Backtesting and Strategy Performance

Backtesting is where dreams often happen. And then live trading arrives with receipts.

Why Backtests Miss Slippage

Many backtests use historical prices without modeling real execution behavior. If the simulator assumes mid-price fills or uses a fixed spread, it may ignore the “gap” between expected and actual fills. As a result, your backtest might show smooth execution and consistent trade results.

In real trading, you may see:

Worse entries due to negative slippage
Different stop-loss triggers because fills happened at less favorable prices
Take-profit exits that occur earlier or later than expected

Even if your backtest uses a realistic spread, slippage can still cause performance drift. That’s because spread deals with the bid/ask gap at one moment, while slippage deals with price changes over execution time.

What to Do About It

If your platform or strategy tooling allows it, improve your backtesting by adding slippage assumptions. You can estimate slippage from your own account logs. Then, set slippage ranges by time of day and volatility level.

One practical approach:
Collect fill data for a few weeks.
Calculate average slippage and worst slippage for each session type.
Use those numbers in your backtest model (even a simple range works better than zero).

Your goal isn’t perfect simulation. It’s better realism, so you don’t end up surprised when the live account behaves like the real world.

Measuring Slippage: What Numbers Actually Matter

You’ll get more useful insights if you track slippage in a consistent way. Otherwise it becomes a feeling, and feelings don’t rank well on search engines.

Track Slippage in Pips (Not Vibes)

For most forex pairs, measure slippage in pips and record it per order. Also keep the currency pair and order type.

Example metrics you can use:
Average slippage in pips
Count of negative slippage orders vs positive
Maximum observed adverse slippage
Slippage differences between market orders and limit orders

Track It by Session and Volatility

Slippage during a major news release can be several times higher than slippage during a calm afternoon. If you lump everything together, you’ll miss patterns.

Separate your data by:
London/New York overlap vs other hours
High-impact news windows vs normal windows
Pairs with higher liquidity vs less-traded pairs

Once you segment the data, your conclusions stop being vague. You can decide, for example, that your strategy is fine in normal hours but needs changes around specific releases.

Broker and Execution Models: Why They Change Slippage

Different execution setups can change how your orders are treated. Even without diving into overly technical detail, you can still make practical decisions.

Market Execution vs Limit Execution

Market execution is the area where slippage most commonly appears. You’re essentially saying: “Fill me now at the best available price.” If the price moves before your order locks, you may end up with a fill that wasn’t your initial hope.

Limit execution is different because you specify the price. That reduces negative slippage, but it also reduces your probability of getting a fill.

Routing and Liquidity Pools

Where your order is sent matters. If your broker routes orders to multiple liquidity providers and tries to find best price quickly, you may see lower slippage. If routing is slower or depends heavily on less flexible counterparties, slippage can rise.

This is another reason broker testing helps. Two brokers can quote the same spread, but fill at different prices during volatile periods due to different internal handling and routing.

Trading Tactics That Reduce Damage When Slippage Hits

Even if you minimize slippage chances, it will still happen. So it helps to design tactics that handle it without blowing up risk control.

Widen Stops Carefully (and Then Recheck Risk)

Some traders widen stop-loss levels to absorb slippage. That can reduce the rate at which slippage causes an early stop-out, but it changes your risk per trade.

If you widen the stop by 2 pips, you also need to adjust position size so your account risk stays constant. Otherwise, you traded slippage problems for size problems. Those are not the group chats you want to join.

Reduce Position Size During High Volatility

If your system indicates you’ll face higher slippage during certain times, lower the size. This makes the “worst possible fill” less damaging.

It’s not about being fearful. It’s about matching your risk budget to real conditions. A smaller position during red-hot volatility often performs better than a big position that gets stopped by execution noise.

Avoid Overtrading Around Execution-Sensitive Moments

If your strategy triggers too many entries when the market is unstable, slippage will become a recurring cost. Consider adding filters based on volatility or spread.

A simple filter is to avoid trading when spreads are unusually high compared to the pair’s recent average. While this doesn’t directly prevent slippage, it often reduces negative fills because liquidity is failing less often.

Positive Slippage: The Part Traders Don’t Complain About (Too Much)

Positive slippage can feel like free money. And sometimes it is. But it’s not something you should plan your strategy around.

Positive slippage tends to occur when:
Your order references a price that becomes better before execution.
Liquidity improves quickly.
The market reverses slightly during the execution delay.

If you build a system that assumes positive slippage regularly, you’re betting that your future executions will line up nicely. In practice, slippage is random enough to make that expectation unreliable. Track it, don’t worship it.

Negative Slippage and “Slippage Disputes”: What to Do

Sometimes traders believe the broker is acting unfairly. Before you start yelling at customer support, do a few checks.

Check the Order Type and Expected Price

If you used a market order, negative slippage is possible by definition during fast moves. If you used a limit order and it filled elsewhere, then you should investigate.

Also check whether the platform showed a price from “last tick” or a cached quote. Some platforms display quotes that can lag in fast conditions.

Review Execution Logs

Most platforms can show an order history with:
Order submission time
Fill time
Requested price and executed price

If you compare those timestamps against known news events, you can often explain slippage just from market behavior. If slippage is repeated even during calm periods, it’s time to test with another account or another broker.

Set Expectations With Your Broker

A good broker explains how market execution works, what slippage ranges are typical, and how they handle liquidity routing. If the answer is evasive or unclear, that’s useful information too.

Slippage Scenarios by Strategy Type

Different strategies “feel” slippage differently. Here’s the practical version.

Scalping

Scalping lives and dies by tight spreads and tight execution timing. One or two pips matters a lot. Negative slippage on entry can eat an entire portion of your take-profit target. It also changes your stop-out frequency.

For scalpers, slippage control usually means:
Choose brokers with strong execution quality
Prefer limit-based entries when possible
Trade during liquid hours

Intraday Swing Trading

Intraday systems tend to have wider targets than scalping, so slippage often matters less per trade. But it still affects risk. Poor fills can alter stop placement and reduce reward efficiency, especially when trades cluster during volatility spikes.

Filters based on time of day and news can help a lot.

Position Trading

Position trades typically use larger stop distances and longer holding periods. Slippage is less likely to dominate performance. Still, if you place large orders during volatile sessions, fills can vary. It’s less common to “lose the thesis” from slippage here, but it can distort exact entry levels.

Common Questions About Forex Slippage

Can I completely eliminate slippage?

No. As long as you trade in live markets and place orders that require execution through time, slippage can happen. What you can do is reduce frequency and reduce the worst-case impact.

Does slippage only happen with market orders?

Most slippage discussions involve market orders because they rely on immediate execution. Limit orders reduce the chance of getting a worse price than planned, but they don’t remove execution variability completely in every situation. Stop orders can also produce an “execution vs stop level” difference during fast moves.

Is slippage always bad?

Technically, no. Positive slippage is good. But you shouldn’t assume it will consistently happen. Over time, both positive and negative slippage will show up. What matters is the average impact and how it compares with your strategy’s expected edge.

Building a Slippage-Resilient Trading Plan

Slippage management doesn’t need to be complicated, but it does need to be consistent. If it’s random in your approach, slippage will feel random in your results.

Decide How Much Execution Error You Can Tolerate

Before trading, determine whether your strategy can handle a few pips of execution variance. If your take-profit is smaller than typical slippage during your trading window, your plan needs adjustment.

Use a “Fill Quality” Habit

Make slippage tracking part of your regular review. Look at:
Which order types caused negative slippage
At what times it spikes
Which pairs suffer more
Whether slippage matches market volatility

This is less about building stats for bragging rights and more about protecting your future decisions.

Adjust Position Sizing Instead of Pretending Everything Is Perfect

If slippage is unavoidable in certain conditions, size down. Your account will thank you later. A stable risk curve beats occasional hero trades that only worked because the market was in a good mood.

Final Thoughts on Forex Slippage

Slippage can be annoying, especially when you’re doing everything “right.” But it’s also a normal part of how live markets execute orders under changing conditions. The market is moving, your order has latency, and liquidity availability changes minute by minute. Once you accept that, slippage stops being a conspiracy and starts being an engineering problem you can manage.

Understanding slippage means you can make smarter choices about broker selection, trading timing, and order types. It also means your backtests become more realistic and your live expectations become more grounded. And while you can’t delete slippage from forex trading, you can absolutely reduce how much it hurts your edge.