What is a Forex Trading Signal and How to Use It?

What is a Forex Trading Signal and How to Use It?

Understanding Forex Trading Signals

Forex trading signals are tools traders use to time their entries and exits in the foreign exchange market. In plain terms, a signal is a message—human-written or algorithm-generated—that tells you when a currency pair may be worth buying or selling. Most signals come with trade parameters so you can act quickly without staring at charts for hours like it’s your full-time job.

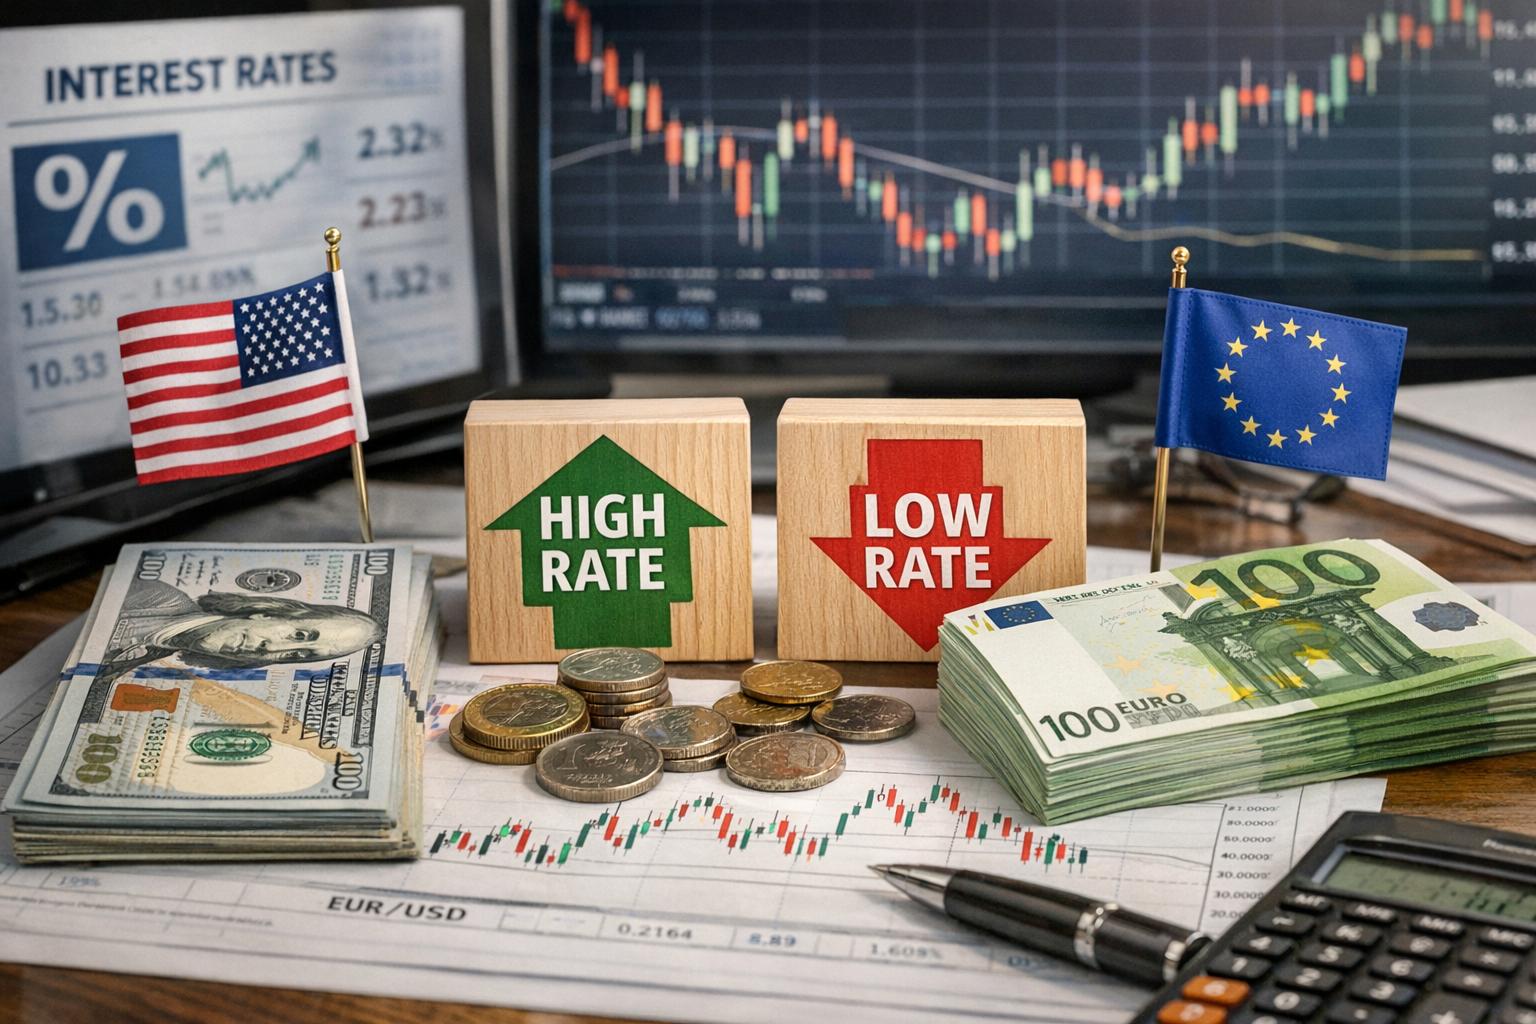
Signals typically rely on some mix of technical analysis (price patterns, momentum indicators, trend signals). Some providers add fundamental context (economic data, central bank expectations), but the majority of widely distributed signals are technical-first because it’s easier to standardize and automate.

The important part is not the hype around signals—it’s how they’re created, how you interpret them, and how you manage the risk when the market refuses to cooperate.

What Forex Trading Signals Actually Are

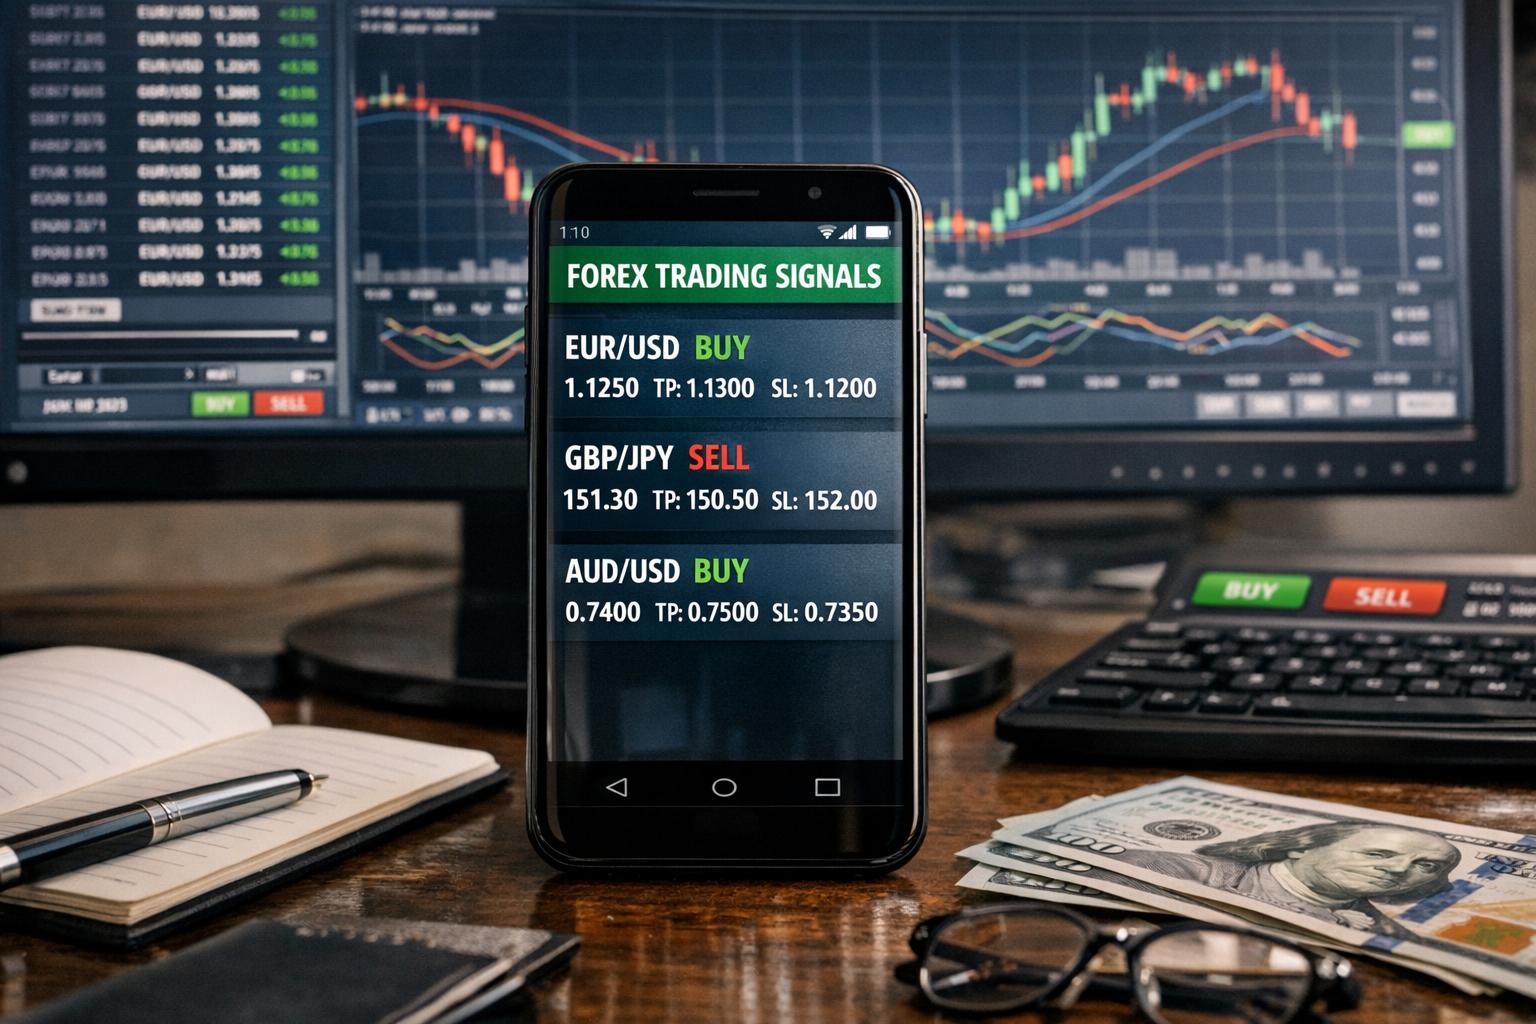
A forex trading signal usually includes:

  • Currency pair: Example: EUR/USD, GBP/JPY, USD/CHF
  • Trade direction: Buy (long) or Sell (short)
  • Entry level: Where you should consider opening or placing a pending order
  • Stop-loss (SL): The price level where you cut the trade if it goes wrong
  • Take-profit (TP) or exit guidance: A target level, sometimes more than one
  • Time horizon: Whether the signal is meant for minutes, hours, or days
  • Rationale: Often includes indicator readings or a short explanation of the setup

If a signal is just “BUY NOW” with no entry, stop-loss, or conditions, it’s basically a guess wrapped in a bow. Signals can be useful, but you should treat them like trading plans rather than magic spells.

Types of Forex Trading Signals

Forex signals differ in how they’re generated and how they’re delivered. Most traders run into two main categories right away. After that, it gets messy in the best possible way—because every provider has their own style.

1) Manual Signals

Manual signals are created by experienced traders or analysts who read the market using charting tools and discretionary judgment. They might spot chart patterns, confirm trends with oscillators, and apply rules learned from years of watching price behavior.

Because manual signals depend on human interpretation, they can reflect nuance. For example, a trader may ignore “almost perfect” indicator alignment if market structure doesn’t confirm the move. On the downside, manual signals can vary in consistency, especially when the trader changes strategies, gets overconfident, or simply has an off day.

Manual signals often come with a brief narrative: “price is bouncing from support, RSI shows momentum shift, wait for confirmation.” That explanation can help you learn something—even if you ultimately trade your own method.

2) Automated Signals

Automated signals are produced by trading algorithms, bots, or rule-based systems. The logic is typically predefined: when certain conditions occur, the system generates a buy or sell instruction.

Automated systems aim to remove emotional bias. They don’t get tired, they don’t “feel” like changing their mind mid-trade, and they can scan multiple pairs quickly. But rules-based systems also have limits: if market conditions shift (like increased volatility or a prolonged sideways range), a strategy that worked before may keep firing signals that don’t fit the new environment.

In other words, automation can be consistent, but consistent doesn’t always mean profitable.

3) Hybrid Signals (Human + Algorithm)

Some providers use a mix: an algorithm suggests setups, then a trader validates and adjusts them. You’ll often see short reasoning attached to the signal, but the “timing” might be driven by code. Hybrid approaches can reduce random mistakes while still adding discretionary judgment.

If you’re evaluating providers, hybrid signals can be appealing—but you should still verify performance and ask how rules are managed, what the system filters, and whether the provider follows risk controls.

Types by Strategy Style

Signals can also be categorized by the trading approach behind them. This matters because it affects the time horizon, the type of targets, and how you should manage price movement.

Common styles include:

  • Trend-following signals: Buy on pullbacks in an uptrend and sell on rallies in a downtrend.
  • Breakout signals: Trade when price moves beyond a support or resistance level with momentum.
  • Range or mean-reversion signals: Trade toward the middle of a range when price stretches too far.
  • Momentum signals: Use indicators like RSI or MACD to spot acceleration and reversals.
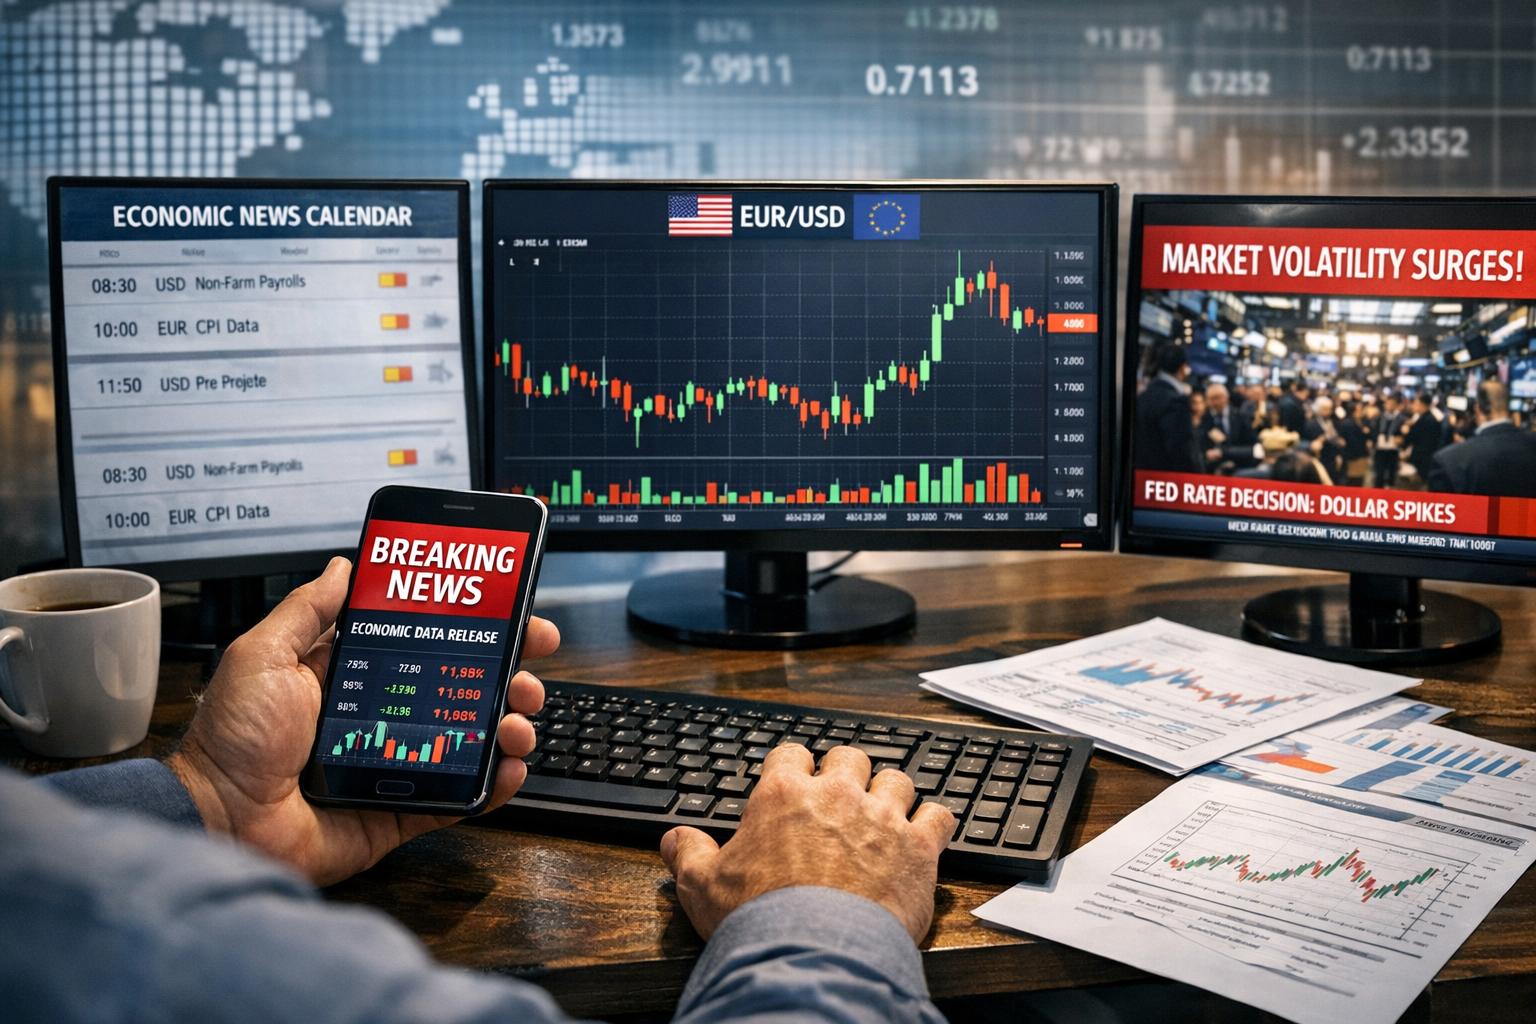
  • News-linked signals (less common in public feeds): Trade around events, volatility spikes, or rate expectations.

If your trading method doesn’t match the signal style, you’ll constantly feel like you’re late to the party—or early enough to miss the point. Matching the approach is half the battle.

How Forex Trading Signals Work

Execution of a forex signal typically follows a predictable workflow: gather market data, analyze it, generate a trade plan, then deliver it to the trader. Each step affects reliability.

1) Data Collection

The signal provider starts by collecting data about price action and sometimes rate-related information. Most technical signal providers pull data from:

  • Price candles (open, high, low, close)
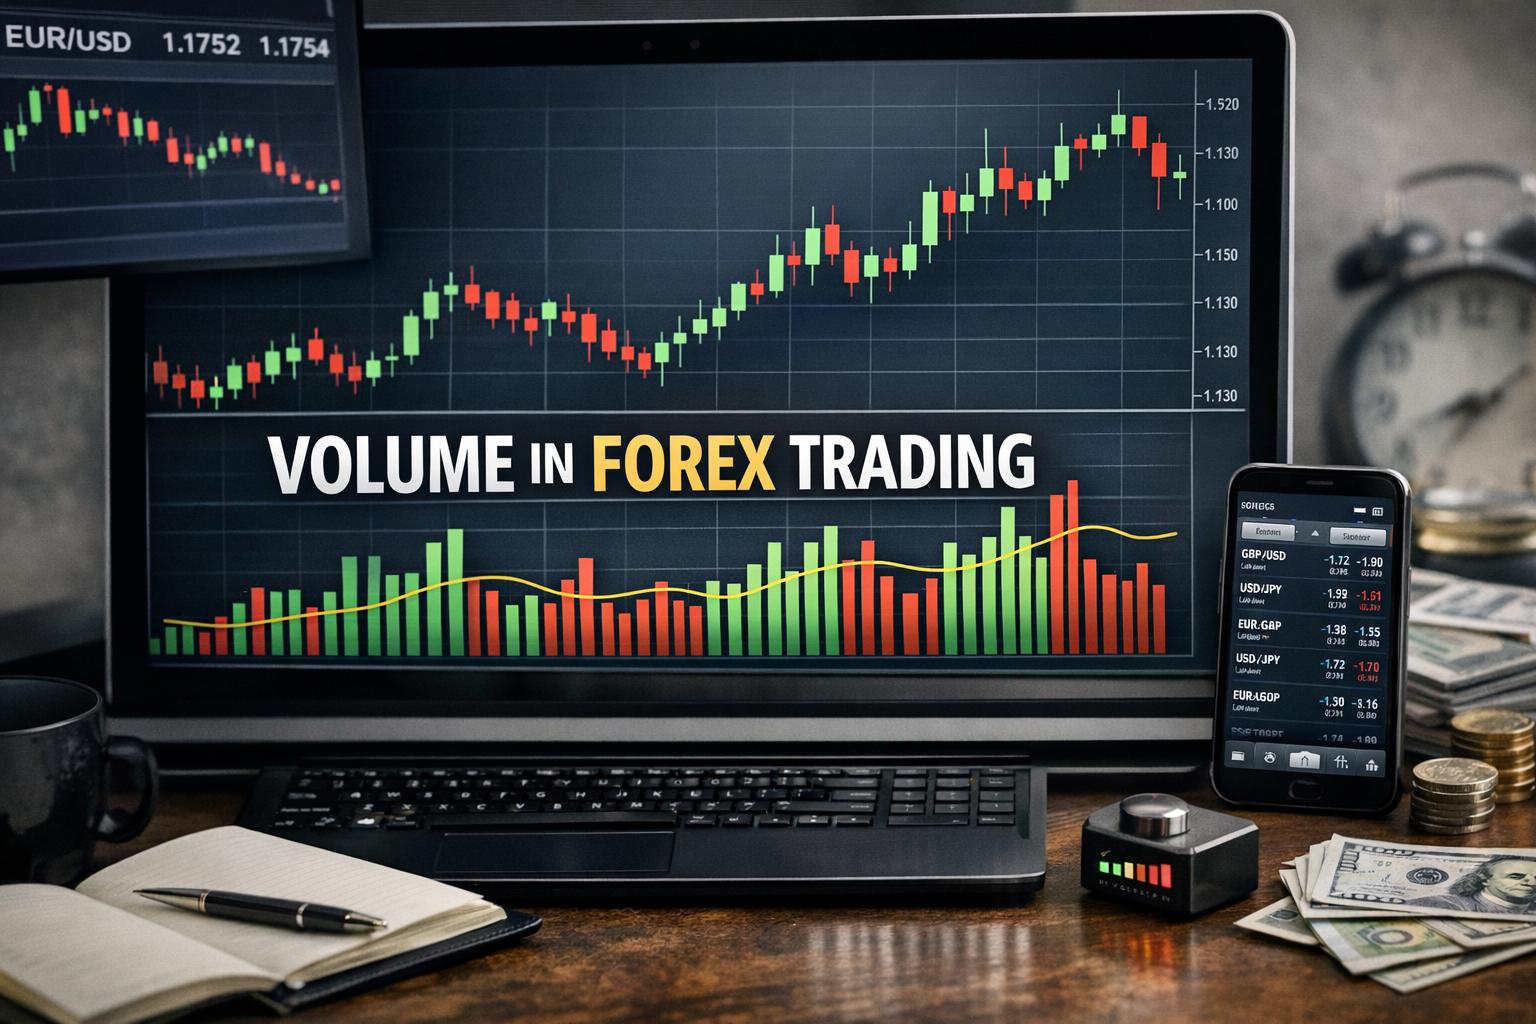
  • Volume (not always reliable in FX retail feeds, but sometimes available)
  • Indicator inputs derived from price data

Technical indicators are common. The original article already mentions moving averages, MACD, and RSI, and these show up constantly:

  • Moving averages: Identify trend direction and dynamic support/resistance.
  • MACD: Measures momentum and trend strength using moving average convergence.
  • RSI: Indicates overbought/oversold conditions and momentum shifts.

These indicators aren’t crystal balls, but they’re useful signal tools when paired with proper entry and risk control.

2) Market Analysis

Once data is collected, the provider analyzes the market to forecast potential movement. Manual providers might look for chart structures like higher highs/higher lows, support and resistance zones, or specific candlestick behavior. Automated providers might use rule triggers such as “RSI crosses above 50” plus “MACD histogram increases” plus “price is above the 200 EMA.”

The analysis step determines how often signals are “in sync” with market structure. A trend-following signal fed into a range-bound market can lead to repeated stop-loss hits. Even good indicators can fail when the underlying market regime changes.

3) Signal Generation

After analysis, the provider generates the signal. A well-constructed signal includes trade direction plus levels. Typically, a signal contains:

  • Currency pair
  • Direction
  • Entry
  • Stop-loss
  • Take-profit targets

Some signals provide additional trade management guidance. For example, they may recommend moving stop-loss to break-even after price reaches a certain level, or they may suggest partial exits if TP1 is hit.

You should pay attention to whether the provider gives realistic levels or just guesses. Realistic levels align with recent swing highs/lows, not random numbers that look good on paper.

4) Signal Delivery

Signals reach traders via different channels. Email, SMS, and dedicated apps are common. Some providers offer real-time push notifications, while others post signals to a web platform.

Delivery speed matters most for short time horizon strategies (scalping or intraday). For swing trading signals with a multi-day window, delivery timing matters less, but your execution still needs to be timely enough to respect the entry conditions.

How to Use Forex Trading Signals

Using signals isn’t just about copying the trade. If you treat a signal like a checklist with no context, you’ll eventually get hurt. The market isn’t impressed by your commitment to the signal.

Choose a Reliable Provider

Selecting a provider is the first filter you should apply. Accuracy varies widely, and some providers are better at marketing than at trading. Start with basic verification:

  • Look for consistent historical performance, not cherry-picked results.
  • Check whether trades were taken according to the signal rules and whether slippage was considered.
  • Prefer providers that explain the strategy and show risk management.
  • Be cautious if results are shown only as screenshots without a trading journal or trackable data.

A provider with a long track record is not automatically profitable, but it’s usually a better starting point than a brand-new telegram channel promising 99% win rates. If something sounds too clean, it often is.

Understand the Signal Components

Before you place any order, understand what each parameter means. A signal with missing details is less useful than it appears.

At minimum, you should be able to answer these questions:

  • Where am I entering? Is it a limit order or market entry?
  • Where am I wrong? That’s the stop-loss.
  • Where am I expecting to be right? That’s the take-profit.
  • How long do I give the market? That’s the time horizon and expected duration.

If you don’t understand why stop-loss is where it is, you’re essentially borrowing someone else’s risk thinking. That can work temporarily, but it won’t teach you how to adapt.

Confirm with Personal Analysis

Signals can speed up decision-making, but they shouldn’t replace your trading plan. Even a quick confirmation matters:

  • Does the signal direction match the broader trend on a higher timeframe?
  • Are the entry and stop-loss placed near logical technical levels?
  • Does the setup align with recent market structure (swing points, breakouts, or range boundaries)?

This doesn’t mean you need to overanalyze. A basic check can catch obvious mismatches, like a sell signal issued into strong upward momentum across multiple timeframes.

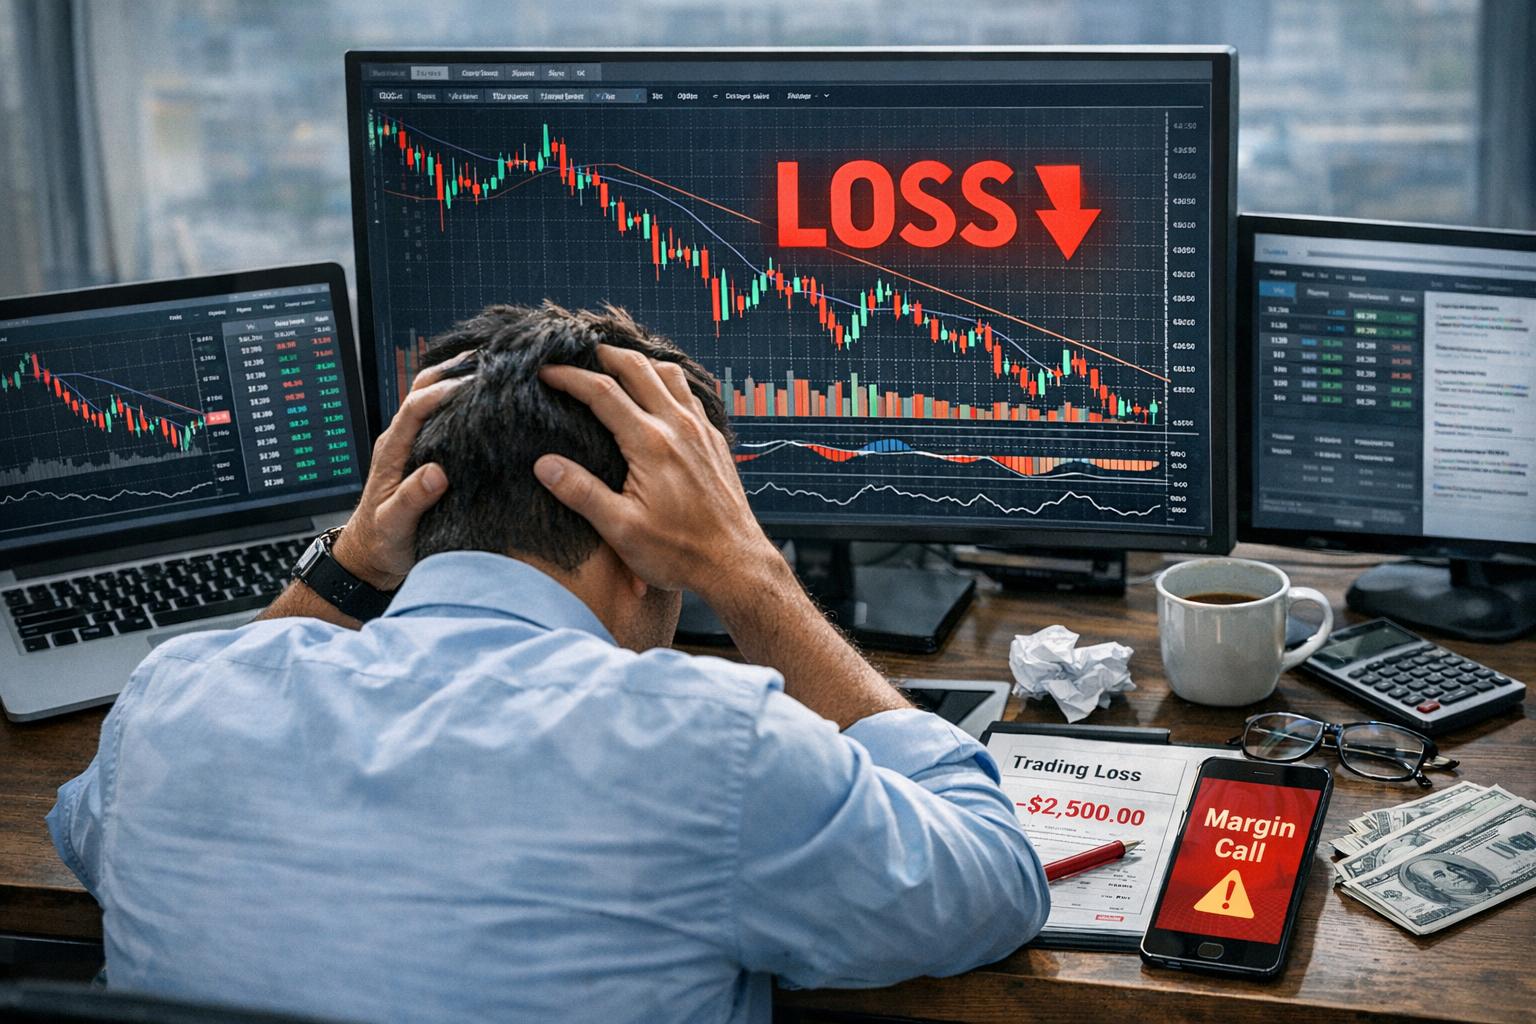
Practice Risk Management

Risk management is where most retail traders win or lose, not with indicators. Even high-performing signal providers produce losing trades—because no method is correct all the time.

When you use signals, risk management should include:

  • Using stop-loss exactly as specified (unless you have a strong reason and a controlled plan to adjust it).
  • Limiting position size so a stop-loss doesn’t blow up your account.
  • Controlling leverage to match your ability to tolerate volatility.
  • Avoiding revenge trading after a stop-loss—signals aren’t obligated to “fix” your emotions.

It’s useful to treat signals as probabilities, not certainties. A string of losses can happen even in a strong system, especially during shifting market conditions.

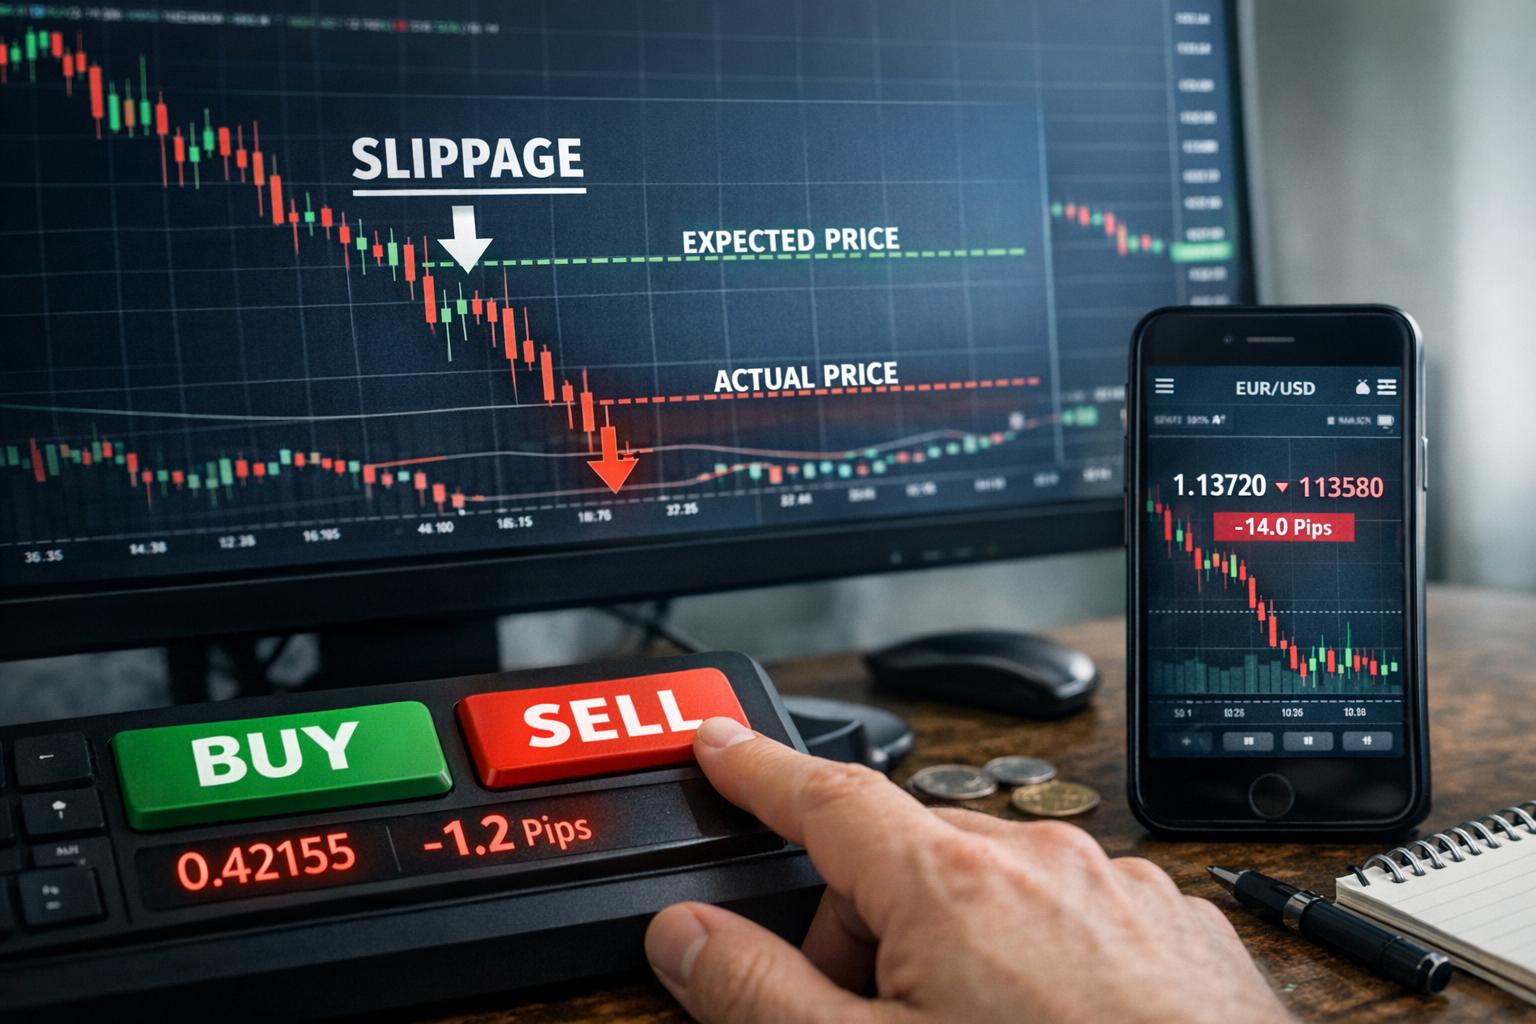
Execution Details Matter More Than People Admit

Many traders fail at execution. They see a signal, but they place the order too late or enter at a different price than the one provided. With spreads and slippage, especially during news events, the actual entry can land outside the intended setup.

If a signal provides a specific entry level, consider whether:

  • your broker’s pricing matches the provider’s reference chart
  • spreads widen around the time of the trade
  • your order type (limit vs market) matches the provider’s plan

Small differences in execution can turn a good trade into a mediocre one. And if you’re trading frequently, those “small differences” pile up.

Common Mistakes When Using Forex Trading Signals

Signals are helpful, but traders tend to misuse them in predictable ways. Here are the mistakes that show up again and again.

Copying Without Context

Some traders copy signals blindly even when their own market view contradicts it. A signal can be correct relative to its strategy rules, but still fail if you’re using a different timeframe context or you ignore broader conditions like major support breakdowns.

Ignoring the Time Horizon

A signal meant for a 24–72 hour move can look “wrong” for the first couple of hours. If you panic and exit early, you turn a trade that should be managed into a trade that’s constantly interrupted.

On the other hand, if you hold an intraday signal for days, you’re no longer trading the same plan. Time horizon is part of the contract—whether you signed it or not.

Using Too Much Leverage

Signals may include stop-loss levels, but they can’t control your account risk. If you size trades too aggressively, normal market noise can hit your stop before the setup plays out.

In FX, leverage can be a tool, but it can also be a fast lane to blowing up a small account. Risk sizing is boring. It’s also effective.

Switching Providers Constantly

Changing providers every week is a common habit. Each new provider claims better performance, but your trading record resets every time you move. You end up chasing claims instead of measuring a consistent strategy.

At minimum, give a provider enough sample size. A handful of trades isn’t “proof.” It’s a rumor with receipts.

Evaluating Signal Quality: What to Look For

If you want to be serious about using signals, evaluate them like a trader would evaluate a strategy. Here’s how to do that without getting lost in spreadsheet hell.

1) Performance Consistency, Not Just Win Rate

High win rates can be misleading if losing trades are much bigger than winning trades. Look at the relationship between average win and average loss. A system with lower win rate can still be profitable if it cuts losses tightly and lets winners run.

2) Risk/Reward Fit

Many signals include take-profit levels. Check whether the TP is realistic relative to stop-loss distance. If TP is always far away and stop-loss is always close, you need a strategy that produces large enough follow-through to justify it.

3) Clear Rules and Strategy Notes

Providers that explain their approach tend to be easier to verify. If a provider can’t describe the logic behind their signals, you should assume the strategy is hard to replicate and hard to audit.

4) Trade History Transparency

Even if the provider is good, you should still verify details. Trade journal data, timestamps, and consistent pair naming matter. If the provider uses chart screenshots, ask for additional evidence of performance over time.

5) Drawdown Behavior

Profit is great. Drawdown is what tests your psychology and account survival. Your next trade matters when your previous trade was a loss. A provider that performs well but causes brutal drawdowns might still fail your account constraints.

How to Incorporate Signals Into a Trading Plan

If you use signals, you need a structure so the signal isn’t just “random trade prompts.” One practical approach is to define a rules-based method around the signals.

Step 1: Determine Your Trading Style Match

Check whether the signal provider’s time horizon matches your schedule. If you work a day job and can’t monitor trades, intraday signals with tight windows can be annoying in the most expensive way.

Swing trading signals often suit people who want fewer decisions per day and more time to manage positions (even if the market still finds new ways to surprise you).

Step 2: Use Higher Timeframes for Sanity Checks

You can keep it simple: use a higher timeframe trend filter (for example, daily direction) and allow only signals aligned with that bias. This avoids taking every signal regardless of context.

It also reduces the emotional impact when a signal suggests a trade that feels wrong in your gut.

Step 3: Decide When You Will Override

You don’t have to follow every signal tweak-free. But you should define override conditions ahead of time. For instance:

  • You only take signals if stop-loss location aligns with recent swing structure.
  • You avoid trading around major scheduled news if your market access widens spreads.
  • You reduce size when signals conflict with your higher timeframe bias.

Overriding isn’t wrong. It’s wrong when you override because you “feel like it.” A plan makes it disciplined.

Real-World Use Cases: When Signals Help

Signals aren’t only for beginners. Even experienced traders use them as time-savers or as a way to spot setups they might miss during busy hours.

Use Case 1: The Busy Trader Who Can’t Watch Charts All Day

Imagine someone who has a full work schedule and can’t track every 5-minute move. A swing-signal feed allows them to check trades a few times per day and manage positions with stop-loss and take-profit levels already set. It’s not glamorous, but it fits real life.

Use Case 2: The Learner Who Wants Feedback Loops

A newer trader may use signals to learn how others structure trade plans—especially stop-loss placement and target sizing. By comparing signal entries to their own analysis, they can understand why a setup is considered valid.

Just avoid the “I used a signal so I must be profitable” mindset. Use signals as an educational input, then build your own evaluation system.

Use Case 3: The Team Approach

Some traders run signal reviews in a team setting. One person monitors broader trends, another reviews signal logic, and a third handles execution. Even though this isn’t always possible for retail traders, small-scale version—like having one person sanity-check trade direction—can reduce mistakes.

Risk Management Beyond Stop-Loss

Stop-loss is necessary, but not sufficient. Risk management also includes the things you do before the stop-loss is even touched.

Position Sizing

Position sizing determines how much you lose if the stop-loss triggers. If you don’t size positions properly, even a “correct” signal can still ruin your account.

A typical approach is to risk a fixed percentage of account equity per trade. Keep the percentage small enough that a losing streak doesn’t destroy your momentum.

Correlation and Exposure

Forex signals often involve multiple pairs that are correlated. For example, buying EUR/USD and GBP/USD can expose you to overlapping dollar-related risk. If multiple signals fire in related pairs, your total exposure can exceed what you planned.

This is why it’s worth checking whether signals are effectively part of one bigger bet.

Trading During High-Volatility Periods

Some signals will be issued around times when volatility is expected—like major economic releases. If your broker spreads widen during these events, your execution can slip.

You don’t have to avoid news entirely. But you should know when volatility rises and adjust size or timing accordingly.

Do Forex Trading Signals Guarantee Profit?

No. Signals can reduce the time you spend analyzing. They can also provide structure and risk parameters. But no one can guarantee profit in FX because markets shift, liquidity changes, and price behavior adapts to new information.

A reputable signal provider should not promise certainty. If a provider guarantees gains, treat it as a marketing tactic. The market will collect on bad promises.

How to Spot Red Flags in Signal Providers

Most traders don’t fail because they “didn’t understand indicators.” They fail because they didn’t understand incentives.

Here are warning signs you should be aware of:

  • Claims of extremely high win rates without showing consistent history over time.
  • No risk management details or inconsistent stop-loss usage.
  • Signals missing entry/SL/TP or changing after the fact.
  • Only promotional content with no strategy explanation.
  • Pressure to subscribe quickly or pay for “VIP access” with vague results.

If you’re paying for signals, you’re buying a process. The process should be explainable and verifiable as much as possible.

Building Your Own Judgment Alongside Signals

Signals work best when they reinforce your decision-making rather than replace it. Over time, you can gradually shift from “follow signals” to “use signals for ideas” while you apply your own filter.

A practical way to do this is to keep a simple trading journal with three notes per trade: whether you followed the signal exactly, whether your confirmation matched, and how execution compared to the signal levels. You don’t need fancy analytics. You just need patterns.

After a few weeks, you’ll see what kinds of setups you accept well and which ones you reject even if they look good in hindsight.

Conclusion

Forex trading signals can be a useful resource for traders who want faster decision-making in the FX market. They may indicate potential buy or sell opportunities and often include entry, stop-loss, and target levels derived from technical and sometimes fundamental analysis. But signals are not a substitute for due diligence.

If you want the odds to improve, pick a provider carefully, understand every part of the signal, confirm with your own analysis, and practice risk management that fits your account size and time availability. With that approach, signals become less like guesswork and more like structured input into your trading process.

For those who want further insight into forex trading signals, focusing on reliable educational resources and consistent evaluation habits can improve results over time. When you treat signals as data you can test rather than promises you must trust, trading becomes a little less mysterious—and a little more manageable.

How to Trade News Events in the Forex Market

How to Trade News Events in the Forex Market

Understanding News Events in Forex Trading

Forex trading on news events isn’t some mystical “future sight” trick. It’s closer to how markets actually work in real time: big releases change expectations, expectations change positions, and positions change price. In the foreign exchange market, traders react to economic updates, central bank signals, and geopolitical headlines that can move currency pairs within minutes.

If you’ve traded forex for any length of time, you’ve probably seen it: the chart looks calm, then a release hits, and suddenly candles appear that look like they were drawn with a marker. The difference between traders who profit from those moments and traders who just donate money to spread costs is usually preparation and process. That’s what this guide focuses on—how to understand the news events that matter, what strategies are commonly used, and how to manage the risks when volatility arrives like it has somewhere to be.

Why News Moves Forex So Fast

Currency markets are forward-looking. Interest rates, inflation expectations, growth forecasts, and risk sentiment all shape what traders believe about the relative value of currencies. When new information contradicts (or confirms) those beliefs, pricing adjusts quickly.

There are a few reasons forex reacts fast to news:

1) Expectations matter more than the raw numbers. It’s common to see a “good” number still cause a currency to fall (because it was less good than expected).
2) Leverage amplifies moves. Many traders use margin, so a fast repricing can trigger stop-losses and margin calls across multiple accounts.
3) Liquidity shifts around major releases. Spreads can widen briefly, slippage becomes more likely, and execution quality matters.

So yes, the news itself matters. But how traders interpret it—relative to forecasts and prior communication—matters just as much.

Types of News Events Affecting Forex

Most forex “news trading” revolves around two big categories: economic data releases and geopolitical events. A third category—central bank communication—often overlaps with economic releases but deserves its own mention because speeches, minutes, and guidance can move markets even when no hard data prints.

Economic Data Releases

These are the scheduled releases coming from ministries, statistical agencies, and central banks. They include employment reports, inflation prints, GDP, trade balance data, retail sales, manufacturing surveys, and more.

Economic releases can be divided into “high-impact” and “medium-impact” groups, depending on how often traders and algorithms react. High-impact releases tend to have clear links to interest rates and growth expectations, which directly influence currency valuation.

Common examples include:

Non-Farm Payrolls (NFP) for the US labor market
Inflation reports such as CPI (consumer price index) or PCE (personal consumption expenditures)
Central bank rate decisions and related statements
GDP reports and growth forecasts
Employment and wage data beyond NFP, such as average earnings

When the actual result beats expectations, the currency often benefits because it suggests stronger growth or hotter inflation, which can lead to expectations of higher interest rates or fewer cuts. When the result disappoints, the opposite may occur.

One detail that’s easy to miss: “better than expected” can still be negative for a currency if the prior market positioning assumed an even better outcome.

Non-Farm Payrolls (NFP) as a Case Study

The Non-Farm Payrolls (NFP) report is one of the most influential economic indicators in forex. Released monthly in the US, it measures the number of employed people excluding agriculture (hence “non-farm”). Traders pay attention to:

The headline payrolls figure (jobs created)
Unemployment rate (labor market slack)
Average hourly earnings (wage pressure, inflation link)
Prior month revisions (sometimes the real story is what changes from earlier data)

A stronger-than-expected NFP often increases confidence in the US economy. That can strengthen the US dollar if traders also expect the Federal Reserve to keep policy tighter for longer. But if wage growth is weak even while payrolls are strong, the reaction might be muted or short-lived. Forex traders, like cats, react more to what moves their assumptions than to what “sounds” bullish.

Inflation Reports and Interest Rate Expectations

Inflation is a direct driver of central bank policy. If prices rise faster than expected, central banks may hesitate to cut rates or may even signal a need for further tightening. That interest-rate expectation typically strengthens the currency.

Inflation reports influence forex through several channels:

Short-term policy reaction: “Should the central bank act now?”
Longer-term expectation: “What will the future rate path look like?”
Risk sentiment: persistent inflation can raise uncertainty about growth and market stability

In other words, inflation data doesn’t just tell you prices today. It tells traders what might happen to rates tomorrow, and rates are the heartbeat of currency valuation.

Geopolitical Events

Geopolitical events include elections, political instability, legislative gridlock, sanctions, conflicts, and major diplomatic developments. These events can influence forex through:

Risk sentiment: how comfortable investors feel holding riskier assets
Safe-haven flows: movement to currencies perceived as stable
Trade routes and energy prices: which can affect inflation and growth
Sanctions and capital controls: which can directly impact economies and cross-border flows

Elections are a common example. Before election outcomes, markets may hedge their positions as uncertainty rises. After the result, the currency might move sharply if investors believe policy direction will shift fiscal spending, regulation, or alignment with trade partners.

International conflict can also drive safe-haven demand. Traders often move funds toward perceived safety—commonly currencies like the US dollar or Swiss franc—depending on the specific context and broader market conditions.

Central Bank Communication

Even without a scheduled economic release, central bank communication can move forex. Statements, minutes, speeches, and the wording of policy decisions can change interest rate expectations.

For example, a rate decision may be “as expected,” but the language might shift from neutral to hawkish (more likely to keep rates higher). That change can still create a tradable move.

This is where many traders get burned—because the number printed wasn’t surprising, but the guidance was. In forex, guidance is basically the market’s favorite kind of “what if.”

Strategies for Trading News Events

Trading on news events is mostly about aligning your trade plan with what news typically does to price. You don’t need a crystal ball. You need a framework: which releases matter, what “success” looks like, and how you control risk when the market does what it does best—surprises.

There are two broad styles: short-term strategies that aim to capture immediate volatility, and long-term strategies that aim to position for economic implications.

Short-Term Strategies

Short-term strategies focus on the immediate reaction after a news release. The trade lifespan can be minutes or even seconds, depending on liquidity and how quickly price moves. This style requires fast decision-making and an acceptance that slippage happens. If you can’t handle that, news scalping can feel like trying to shave with a bicycle chain. Messy.

Volatility Breakout Strategy: This strategy aims to profit from sudden price movement following a news event. Traders often plan entry and exit levels using recent volatility, previous highs/lows, or predefined pip distances.

Typical flow looks like this:

– Identify the major release and expected volatility window
– Place conditional orders or plan manual entries once price breaks a level
– Use tight risk controls because the initial move can fade quickly

A breakout trade works best when the news meaningfully changes expectations rather than just nudging them. If the market expected one thing and receives another clearly different result, breakouts are more likely to have follow-through.

Straddle Strategy: A straddle tries to capture the direction of a major move without guessing which way it will go. Traders place buy and sell stop orders on opposite sides of the current price, positioned above and below it. Once price breaks out, one side triggers and the other side typically remains inactive.

This is commonly used ahead of scheduled high-impact releases because the market often “chooses a direction” after the numbers land. If it moves sharply upward, the buy stop triggers; if it drops, the sell stop triggers.

It’s not magic, though. The biggest risks are:

– Spreads and execution slippage during the announcement
– The move triggers, then reverses (whipsaw)
– One side triggers too close to the noise, not the trend

So straddles can be effective, but your order placement and risk settings matter more than optimism.

Long-Term Strategies

Long-term news strategies are less about the first spike on the chart and more about what the news changes in expectations over weeks and months. If short-term trading is reacting to a loud signal, long-term trading is positioning for a policy shift or sustained economic trend.

Fundamental Analysis: In fundamental analysis, traders interpret what news means for future economic conditions and policy rates. For example, if employment and inflation data consistently point toward higher rates, traders may prefer that currency over time.

With central bank policy, the logic is straightforward even if it’s not always pleasant:

– Higher expected interest rates attract capital
– Capital inflows support the currency
– Stronger growth and controlled inflation reinforce that view

However, interpretation matters. A country can post strong growth but still face future rate cuts if inflation is cooling or political pressure increases. So traders often look beyond the headline and compare multiple indicators.

In practice, traders might track:

– Inflation trends versus central bank targets
– Wage growth versus productivity
– Market pricing of interest rate changes (as reflected in futures or implied yield measures)
– Consistency across releases rather than a single print

Position Trading: Position trading takes fewer trades and holds them longer. The objective is to profit from larger shifts in currency valuation tied to economic news, often including:

– sustained interest rate divergence
– persistent inflation or growth trends
– longer-term geopolitical developments affecting risk and investment

For example, if a sequence of releases keeps pushing a central bank toward tighter policy, traders may hold a long position on that currency for weeks or months. The trade plan usually depends on the difference between “policy expectations” and “market expectations” at the time of entry.

Position trading can feel calmer than news scalping, but it still has its own way of humiliating people: if your thesis is wrong, the market doesn’t care that you’re “waiting for it to come back.” So discipline and risk controls still matter.

Managing Risks Associated with News Trading

News trading is popular for a reason: volatility can create opportunity. It’s also popular for a reason that’s less fun: volatility can wipe out inexperienced accounts quickly. Risk management isn’t optional here. It’s the seatbelt.

Setting Stop-Loss Orders

Stop-loss orders limit losses if the market moves against you. In news trading, stops are especially important because price can gap, whip, and overshoot. A well-placed stop can prevent “one bad minute” from becoming “one bad month.”

Key considerations for stop-losses during news:

Use realistic stop distances: stops too tight can be hit by normal volatility. Stops too wide can make the loss too large relative to your account.
Expect spread widening and slippage: your stop may execute at a slightly worse price than the level you set.
Know your invalidation level: your stop should align with when your thesis is wrong, not where you hope price will go.

For example, if you trade an inflation surprise expecting hawkish repricing, your thesis might be invalidated if price moves against you and holds. That’s when you accept the loss rather than arguing with the market.

Using Proper Leverage

Leverage can turn small price moves into outsized gains—but it can also create outsized losses when volatility hits. During major announcements, currency pairs can move far more than your broker’s “normal” assumption for spread and execution quality.

A practical approach is to match leverage to your ability to tolerate swings. Traders often underestimate how much volatility compounds with leverage. If you use high leverage for calmer markets, you’ll likely reduce position size for news trading.

Some traders do the simplest thing: lower the trade size around major releases. Even if your strategy is right, the market can still move through your stop before deciding to reverse.

If you want a rule of thumb (not a guarantee), treat news windows as moments when position size needs discipline more than bravery.

Choosing the Right Trading Window

Not every moment around a news release is equally tradable. Price behavior changes depending on:

– the exact time of release
– the initial reaction versus subsequent repricing
– liquidity conditions
– what other correlated releases hit around the same time

Many traders prefer to avoid placing orders far outside the announcement moment. Others place orders, but only after confirming something—like direction from broader market context—or after the first spike stabilizes.

The wrong approach is “set it and forget it” when your plan depends on execution quality. News can move quickly enough that your “set” becomes just a delayed regret.

Planning for Whipsaws and False Breakouts

Whipsaw is when the market moves sharply in one direction and then reverses. It’s common in news trading because:

– the first move reflects the immediate interpretation
– additional market participants adjust positioning afterwards
– traders react to revisions, not just the initial figure
– implied expectations were different than the one-line forecast

To reduce the damage, traders often:

– take partial profits early
– move stops to reduce risk after a move has proven itself
– avoid entering late once price has already traveled far

Whipsaws don’t mean your strategy is broken. They mean you need better entry timing, clearer risk rules, or both.

Building a News Trading Workflow (What to Do Before the Market Reacts)

Most people don’t lose money because they lack intelligence. They lose it because the process is missing. News trading forces a workflow. Here’s what that workflow usually includes.

1) Identify Which Releases Actually Matter to Your Pairs

You trade currency pairs, so you care about releases tied to those countries’ economies. A US-focused trader naturally prioritizes US data for USD pairs. Similarly, EUR traders focus on eurozone indicators and ECB communications.

This sounds obvious, but many traders keep a generic “economic calendar” habit and react to whatever is trending online. That’s how you end up trading the wrong news for the wrong pair at the worst time.

2) Compare Actual Results to Expectations, Not Headlines

Expectations are embedded in price already. The market often moves when the actual print differs from what traders priced in.

So instead of asking “was it good or bad?” your checklist becomes:

– Did it beat the forecast?
– By how much?
– Did the report include components that matter for inflation or policy?
– Did the revision change the story?

A small beat might not move much. A large divergence can move markets dramatically. And sometimes the “beat” triggers a sell because it implies policy tightening faster than traders anticipated.

3) Check the Market’s Rate Expectations

Even if you don’t trade interest rate products, you can still think in terms of rate expectations. Market pricing often reflects the idea that central banks respond to inflation and growth. So you want to know what traders already believe about the future rate path.

If the news confirms the market expectation, the reaction may fade. If it contradicts it, volatility often persists longer.

4) Decide Your Trade Plan Before the Release

This is where many traders fail: they decide after the candle appears. By then, spreads, emotion, and execution quality have already joined the party.

A real plan usually includes:

– your entry method (conditional orders, breakout level, or manual entry timing)
– your stop-loss logic (where invalidation happens)
– your target approach (fixed, partial exits, or “trend continuation” style)
– your maximum loss per trade

News trading doesn’t forgive improvisation. The market is too fast and your average human reaction time just isn’t.

Common News Trading Mistakes

If you’ve ever watched a news release unfold and thought “I swear I was right,” you’ve probably made at least one of these mistakes.

Mistake 1: Trading Every Headline

Not every headline is market-moving. Some announcements carry low impact or are expected in advance. When you trade too many releases, your risk exposure increases and your hit-rate often drops.

Better approach: trade fewer events, but trade them with preparation.

Mistake 2: Ignoring the Details (Wages, Core Inflation, Revisions)

Headlines can be misleading. A jobs report is more than payroll counts. Wage growth can change the inflation outlook. Inflation reports often have “core” measures that exclude certain components. Revisions can change the narrative to match or contradict earlier prints.

If you ignore these details, you end up responding to noise rather than information.

Mistake 3: Overconfidence After a Big First Move

Many traders enter on the first direction and then panic when the market retraces. But the first move is often the market reacting to the initial interpretation. Sometimes a second wave reprices the trade once more participants digest the full content of the release.

That’s why patience—or at least a flexible exit plan—is valuable. Sometimes the best trade management is “hold for confirmation” rather than “assume the first candle is the final verdict.”

Mistake 4: Unrealistic Stops and Position Size

Stops that are too close during news tend to get hit even if your thesis is correct. Position sizing that is too large creates forced exits due to leverage effects—not because you were wrong, but because you’re overextended for the volatility.

Your goal is survival first. Profit is what happens after survival.

How to Use an Economic Calendar Without Becoming a Full-Time Meteorologist

Economic calendars are essential for news trading. But there’s a difference between using one and living inside it.

A practical use pattern:

– mark the releases that impact your traded currencies
– note the “high-impact” events and expected forecasts
– confirm time zones and your broker server time
– plan what you’ll do in the first minutes after the release

When the market hits, you don’t want to spend your attention figuring out whether the event already passed. You want to execute the plan you wrote while you still had a pulse and free will.

Putting It Together: Example Scenarios

To make this less abstract, here are a few realistic scenarios that explain how news trading often behaves.

Scenario A: NFP Beats Forecast, Wages Also Rise

Assume US NFP comes in stronger than forecast, and average hourly earnings are also higher than expected. That combination tends to push expectations for stronger inflation pressure and tighter policy. Many traders look for USD strength across major pairs.

A short-term breakout trader might place conditional orders around relevant resistance/support levels and trade the first direction if breakouts confirm. A longer-term trader might build a position expecting sustained rate divergence.

Scenario B: Inflation Drops More Than Expected, But Growth Is Still Strong

If inflation surprises lower, central bank pressure to keep rates high may ease. But if growth is still strong, the currency reaction might be mixed. The market might not fully “sell” the currency if growth keeps policy from turning too dovish.

That’s why traders compare multiple components, not just the headline inflation number.

Scenario C: Political Uncertainty Increases Ahead of an Election

In some cases, the market reacts more to uncertainty than to policy details. Risk sentiment can drive investors toward safe-haven currencies. If the election results later reduce uncertainty, the currency might rebound sharply as hedging unwinds.

News traders watch for the difference between “fear pricing” and “new information pricing.” Those aren’t always the same.

Conclusion

Trading forex based on news events offers opportunities for both short-term and long-term gains, but it demands disciplined preparation and risk management. You’ll do better when you treat news as a change in expectations rather than a scoreboard of good and bad numbers. Economic indicators like NFP and inflation reports can reshape central bank expectations. Geopolitical events can shift risk sentiment and safe-haven demand. Central bank communication can move markets even when data seems “fine.”

If you want to keep your situational awareness strong, it helps to use a consistent feed for schedules and analysis such as Forex Factory or DailyFX. Being aware of the economic calendar and anticipating what might move your chosen pairs lets you plan trades ahead of time rather than reacting while the spread is widening.

Effective news trading still comes down to execution, emotional control, and a workflow you can repeat under pressure. When you handle those parts well, volatility stops being a random punch to the face and starts behaving like what it is: tradable market behavior.

The Importance of Trading Psychology in Forex Success

The Importance of Trading Psychology in Forex Success

The Role of Trading Psychology in Forex Success

Forex trading is not only about charts, indicators, and macroeconomic headlines. You can have a solid strategy and still bleed money because your brain starts bargaining with you at the worst possible moment—right when your plan is supposed to run the show. Trading psychology is the part of the process that explains why two traders can see the same setup and produce wildly different outcomes.

In other words: the market doesn’t change because you feel nervous. But your decisions do. When traders learn to manage emotions, improve self-control, and build repeatable habits, their performance usually becomes more consistent. This article focuses on the mental mechanics behind trading decisions—what goes wrong, why it happens, and how to fix it without turning your trading life into a 24/7 mindfulness seminar.

Understanding Trading Psychology

Trading psychology refers to the emotional and mental state that shapes your decision-making. It includes how you interpret uncertainty, handle losses, react to wins, cope with drawdowns, and follow your own rules. Market conditions may be chaotic, but your internal conditions can be chaotic too—and that’s often the real problem.

At the center are emotions like fear, greed, frustration, and anxiety. These aren’t “bad” in a moral sense; they’re just signals your brain produces under stress. The danger comes when emotion starts overriding your strategy. A trader who can recognize the emotion quickly can still act, but in a way that matches the plan rather than the mood.

There’s also a mental layer that sits underneath emotion: beliefs about your ability, your confidence in the system, and your expectations of what “should” happen. For example, if you assume you’re due for a win after a losing streak, you may start taking trades that don’t match your criteria. If you believe losses mean you’re doing something wrong, you may hesitate to cut positions that should be closed. Psychology isn’t just about feelings; it’s about assumptions that determine behavior.

What Psychology Does to Decision-Making

Your trading decisions usually come from a process that looks like this: you see information, interpret it, decide, execute, and then evaluate. Trading psychology affects the interpretation and evaluation steps the most.

When you’re calm, you tend to interpret setups based on structure and probabilities. When you’re stressed, your brain shifts toward threat detection—what can go wrong—and you may overweight negative outcomes. After a loss, many traders interpret the same market differently, even when nothing materially changed.

When you win, the brain often does something else: it assigns the win to your skill and the loss to randomness. That’s fine as a temporary story, but it becomes dangerous when it leads to increased risk or sloppy execution. Eventually, your behavior drifts and your results follow.

Emotions Are Useful Data—Until They Aren’t

Emotion can be a source of valuable insights. For example, fear before entry might be your brain detecting that you’re forcing a trade, that liquidity is thin, or that the setup is less clean than you want to admit. Greed can sometimes show up when the reward-to-risk looks unusually good, and your brain latches onto easy profit thinking.

But here’s the catch: emotions are noisy. Your job isn’t to obey them. Your job is to interpret them like a dashboard light. When you feel an emotion, you ask a simple question: “Is this a warning that my trade doesn’t match my plan?” If the answer is yes, you pause. If the answer is no, you execute according to your rules even if your stomach feels like it’s filled with unsweetened coffee.

Common Psychological Pitfalls

Most psychological issues in forex trading fall into a handful of buckets. You don’t need to “fix your personality.” You need to recognize the patterns and stop feeding them.

Overconfidence is one of the most frequent problems. It often appears after a string of wins, when your confidence spikes and your risk management loosens. This can happen subtly. A trader might start increasing lot size, skipping a portion of the analysis, or taking trades that are slightly outside the original strategy because “it’s basically the same.” Overconfidence creates a blind spot: the trader starts believing they’ve mastered the market’s behavior when they’ve only mastered a short sample of outcomes.

Fear is the flip side. Fear can prevent traders from entering trades that meet their criteria. Instead of waiting for a proper setup, they wait for emotional comfort. The problem is that emotions rarely provide accurate timing. A “safe feeling” does not equal an edge. Fear also causes premature exits, especially when a trade goes into drawdown and the trader decides the market is “definitely reversing.” Sometimes it is. Often it isn’t—and the trader just paid a tuition fee to a market that doesn’t care.

Inability to accept losses can lead to holding losing positions longer than necessary. This is driven by hope: the belief that the price will come back to your entry just because you want it to. Traders get stuck in what looks like patience but behaves like denial. The hope-despair cycle describes the emotional oscillation between optimism and disappointment. You expect recovery, you see it almost happen, you feel relief, and then the market moves against you again. Each swing makes it harder to act rationally.

Revenge trading follows that cycle. After a loss, the trader wants to “win it back” quickly, which turns trading into a reaction instead of a strategy. Revenge trading tends to reduce discipline: you enter faster, justify questionable setups, and abandon the risk plan because you’re trying to fix an emotional problem with money.

Chasing and late entries are another issue. When price moves without you, you feel like you missed the boat. So you jump in after the move has already happened. In many strategies, late entries carry worse structure and higher risk. Psychology makes you pay the “missed opportunity tax” with your account balance.

Results-thinking also causes damage. Some traders evaluate their strategy based on profit alone instead of process. If a trade loses but followed rules, it still has value as data. If a trade wins but violated rules, it may tempt you to keep the violations going. Results-thinking turns your trading plan into a hostage situation: the market controls your confidence rather than your process.

Strategies to Manage Trading Psychology

The good news is that trading psychology is trainable. Not in the “be positive and everything works out” way. Trainable in the “change your inputs and your behavior will follow” way. You can build structure around decisions so your emotions have less room to hijack the plan.

Build a Trading Plan You Can Actually Follow

A trading plan reduces emotional decision-making by forcing you to follow rules during both calm and stressful moments. It should cover what you trade, why you trade it, when you enter, when you exit, and how you size risk.

Most plans fail for one boring reason: they’re too vague. “Buy when the trend is strong” is not a plan. “Buy EURUSD on a daily trend alignment with a defined trigger, place a stop based on swing structure, and risk 1% per trade” is closer to something you can execute without improvising like a jazz musician.

When your plan is specific enough, you can treat your emotions as an alert system instead of a boss. If the setup exists, you can enter. If it doesn’t, you wait—even if waiting feels like losing time.

Use Risk Management as Emotional Management

Risk management isn’t just for math. It’s for your mindset. If position sizing is capped and consistent, losses become less personal. They become measurable outcomes within a process.

When traders ignore risk limits, every loss becomes a bigger psychological event. That increases the likelihood of revenge trading, overcorrection, or “I’ll just risk more to recover faster.” A good risk system keeps the account from turning every minor mistake into a crisis.

A simple way to think about it: if your risk per trade is reasonable, your brain has less reason to panic. It’s harder to feel helpless when your plan limits damage.

Maintain a Trading Journal That Captures Emotions, Not Just P/L

A trading journal helps in two ways. First, it turns your trading history into pattern data you can review. Second, it captures the emotional context that production systems often miss.

Instead of only recording entry, exit, and results, log a short note about your mental state and the situation before you traded. For example:

  • “Felt rushed; entry was earlier than planned.”
  • “Felt confident after prior wins; increased size.”
  • “Felt fear during drawdown; moved stop further than planned.”

Over time you’ll begin to see correlations between emotions and behavior. Many traders discover they don’t have a strategy problem—they have a trigger problem. Maybe the real pattern is entering impulsively after a news spike, or exiting too early when you’re up but not at the take-profit level. The journal gives you evidence rather than guesses.

It also helps to track what you did right, not only what you did wrong. If you never record wins as part of the process, you’ll forget what discipline looked like when it was working.

Practice Pre-Trade and Post-Trade Checklists

Checklists are underrated because they feel “robotic.” That’s the point. You want to reduce room for improvisation. A pre-trade checklist can include: “Does the setup match rules?” “Is the stop placed based on structure?” “Is risk within limit?” “Do I understand the exit conditions?”

A post-trade checklist can focus on behavior: “Did I follow the plan?” “Did I change anything emotionally?” “What did I learn?” That helps switch your brain from outcome chasing to process evaluation.

This is particularly useful during drawdowns. When your confidence drops, you stop trusting yourself. A checklist acts like a decision prosthetic—temporary, but helpful.

Maintain a Balanced Lifestyle to Reduce Stress Effects

A balanced lifestyle supports better decision-making. Regular exercise and adequate rest improve stress tolerance. That matters because trading stress can be cumulative. If you’re constantly short on sleep, your patience shrinks. Your tolerance for uncertainty drops. You may interpret normal price fluctuation as a threat rather than background noise.

Relaxation techniques—breathing exercises, meditation, walking, or even turning music on while reviewing charts—often help, but the main goal is consistency. Traders who train their routines usually trade with fewer emotional spikes than traders who only manage stress when things go wrong.

Also, watch the “life distraction tax.” Long workdays, family stress, and poor eating habits show up in your charts as haste and impatience. Not glamorous, but common.

The Impact of Mindset on Trading Performance

Skill matters, but mindset shapes how you use that skill. It influences whether you treat trading as learning or as judgment. It determines whether losses are treated as feedback or as proof that you’re failing.

A growth mindset is one of the most practical approaches. It means you focus on learning and improvement, not on proving your identity as a “great trader” or “not a trader.” With a growth mindset, losses don’t trigger shame. They trigger review. You ask: “What did I do? Was it within my rules? If not, what do I change?”

This style of thinking builds resilience. Forex markets can be brutal over short time periods, and resilience is not a personality trait you either have or don’t. It’s a response pattern you develop.

Emotional Intelligence: Knowing What You Feel and Why

Developing emotional intelligence helps you manage emotions without pretending they aren’t there. Emotional intelligence means you can identify what you’re feeling, trace it to the situation, and decide how to respond.

For example, a trader might feel “confused” during a trade. Emotional intelligence asks whether “confused” actually means “uncertain about plan execution,” or whether it’s code for “I don’t trust my stop,” or whether it’s “I’m seeing things that aren’t in the chart.” If you can label the feeling, you can address its cause.

This also helps with adaptation. Markets change. Your setups may degrade. A trader with higher emotional intelligence is more likely to pause and reassess rather than stubbornly apply a strategy after it stops performing.

Risk Perception and How It Drives Behavior

Mindset influences how you perceive risk. If you treat risk as a highlight reel—“risk is exciting”—you might ignore limits. If you treat risk as a controllable tool, you’ll size appropriately and stick to stops more consistently.

Many traders don’t lose money because they don’t know about stops. They lose because they relate to stops emotionally. A stop feels like a promise being broken, a signal that you “were wrong.” But your system should treat a stop as a tool, not a personal verdict. When your mindset supports that, decision quality improves and you reduce needless emotional interference.

Common Mindset Errors Traders Don’t Talk About

There are a few mindset mistakes that sound harmless until they show up in your trading account:

  • All-or-nothing thinking: “If I’m not up today, I failed.” That pushes revenge and activity bias.
  • Over-identification: “My strategy is me.” When the strategy produces losses, the personal ego gets bruised.
  • False certainty: “This time the market has to respect my level.” Markets don’t bargain.
  • Ignoring variance: Expecting smooth equity curves. Real trading includes periods of randomness and grind.

These beliefs shape behavior on both sides of the trade—entry decisions and exit decisions.

Psychology in Real Trading: What It Looks Like Day to Day

Let’s make this practical. Imagine a trader who has a decent system but struggles with discipline. The system looks good on paper. The charts often match entry criteria. But the trader’s emotional pattern repeatedly creates avoidable errors.

On a Tuesday morning, the setup appears. The trader likes the chart, but price is a touch extended from the entry point. The plan says “only enter at the trigger.” The trader feels impatient. Instead of waiting, they enter early, “just this once,” and the stop gets tagged. That loss doesn’t just hurt the account; it fuels the next day’s behavior.

On Wednesday, after a loss, they become risk-averse. They start skipping trades to avoid another stop-out. Then they chase a later move because they refuse to miss the opportunity again. The trade ends in a partial loss, but this time the trader also starts adjusting the stop “to give it room.” The emotional driver is fear of realizing the stop-out again.

Now the account is down, and the trader’s confidence is low. They start searching for a “stronger sign” that doesn’t exist. They overtrade until they find something worse than their original setup. It feels like desperation because, psychologically, it is.

This pattern is common. It’s not a sign that the strategy is worthless. It’s a sign that emotional triggers are changing behavior: overconfidence after wins (bigger size, looser criteria) and fear after losses (skip rules, move stops, revenge trades).

Tools and Techniques That Support Trading Discipline

Think in Rules, Not Feelings

One of the best ways to manage psychology is to convert it into rules your brain can follow under stress. Instead of “I’ll feel confident enough to enter,” you define “I enter only when X occurs.”

If you do that, the trading decision becomes a checklist verification rather than a mental debate. The market will still be unpredictable; your execution won’t be constantly negotiated.

Separate Trade Planning From Trade Execution

Many traders plan while emotionally engaged. They look at a setup, feel excited or worried, then execute immediately. When emotions spike, plan accuracy drops.

A cleaner method is to do planning with full attention, then execute without renegotiating. That might mean: mark the setup, set the order, and step away for a moment. Not because you’re scared of your own trade, but because you’re reducing the chance of “fixing” when nothing is broken.

Use Limits on Frequency When You’re Overstimulated

Trading psychology gets worse when you’re tired, bored, or overly focused. Some traders start charting constantly, hunting for setups that aren’t in the strategy. That’s when mistakes increase.

If you notice that pattern, create a rule: maximum number of trades per day, or maximum active analysis windows. That reduces the chance of impulsive entries.

Reframe Losses as Feedback

Losses feel personal when you interpret them as failure. But losses are part of any probabilistic system. Even good strategies experience losing streaks because markets are noisy and because probabilities don’t guarantee a straight line.

A useful reframe is: “This loss helps me locate where my process deviated.” If your process followed the plan, you learn about variance and market conditions. If it didn’t, you learn about your triggers. Either way, the loss becomes information rather than a verdict.

When You Should Pause Trading

There are times when trading psychology is telling you to step back. Those times don’t require drama. They require honest observation. If you’re unable to follow your rules, if you feel angry, if you keep checking price obsessively, or if you’re making “fixes” like moving stops without a rule—pause.

A pause can be an hour, a day, or longer. The point is to stop the behavior spiral. Many traders only pause after damage. Better to pause before the account takes a bigger hit.

How Long Does Trading Psychology Training Take?

There’s no fixed timeline, because it depends on how consistent you are with journaling, checklists, and plan execution. But you can expect changes to show up in a measurable way rather than a motivational way.

In practice, many traders notice improvement when they reduce rule violations. The first wins often come from preventing the obvious psychological mistakes: no revenge trading, no late entries, no “one more trade” after a loss, no random stop changes. Over time, you’ll likely become more consistent in execution even when emotional heat rises.

It’s tempting to want faster results. If you’re improving your process, it will feel slow. That’s because consistency usually grows from small corrections, not from one big breakthrough session.

Conclusion

Trading psychology is not a side topic. It’s the operating system behind your strategy. Even when your technical analysis is decent, emotions and beliefs shape how you enter, how you manage risk, and how you respond to losses and wins. That’s why traders who understand trading psychology often perform more consistently: they reduce rule violations and turn emotions into usable signals.

A trader who recognizes their psychological tendencies gains an advantage that charts can’t provide. They can harmonize emotion with strategy and keep decision-making aligned with the plan. The forex market will still move unpredictably. The difference is that your process stays intact.

For more insights into the world of forex trading, consider visiting reliable trading resources. Through continual learning and adaptation, traders can enhance their trading acumen and navigate the challenging yet rewarding terrain of the forex market.

Understanding Forex Slippage and How to Minimize It

Understanding Forex Slippage and How to Minimize It

Introduction to Forex Slippage

In forex trading, slippage shows up more often than most traders expect—usually on the day they swear they’re being careful. Slippage is the gap between the price you thought you were getting and the price your trade actually fills at. If you’ve ever placed an order expecting a clean entry and then watched the chart print a fill that’s a few pips worse, you’ve seen slippage in action.

While one trade won’t make or break your account, slippage becomes a real issue when you trade frequently, hold tight profit targets, or run automation that places orders at high speed. It’s also worth knowing that slippage doesn’t affect every broker equally. Different execution models and liquidity sources can change how often you get decent fills versus “surprise, here’s a worse price.”

What Slippage Looks Like in Real Trading

Slippage usually comes up in one of these scenarios:

When you place a market order (you accept the current price), but the market moves during order processing.
When liquidity thins out (fewer buyers/sellers), so your order can’t match at the intended level.
When volatility spikes (news releases, sudden geopolitical headlines), causing rapid price jumps.

A lot of traders describe it as “the broker changed the price.” More accurately, the market changed while your order was moving through the execution chain. Even the best systems can only execute against what’s available at the moment the request is processed.

What Causes Slippage?

Slippage is primarily caused by market volatility and liquidity. During highly volatile periods, such as after major news announcements, prices change rapidly, so trades can fill at prices different from those seen at order placement. Additionally, low liquidity in the market can cause slippage, because there may not be enough buyers or sellers at the specific price level your order needed.

Market Volatility

Market volatility refers to how quickly and sharply the price of a currency pair moves. In high-vol environments, a bid/ask can shift multiple times in a second, and your order may not lock onto the price you expected.

This is common around:

Major economic news releases (inflation, jobs reports, central bank decisions)
Geopolitical developments that alter risk sentiment
Unexpected policy statements that move interest-rate expectations

When volatility rises, the spread can widen too. The spread widening means even “normal” price moves start to feel more expensive.

Liquidity Levels

Liquidity is the availability of buyers and sellers at different price levels. With higher liquidity, trades match more easily, and fills are closer to the quoted price.

Low liquidity tends to show up when:

Trading occurs during off-market hours
You trade during thinner session overlaps
You trade less popular pairs that don’t have consistent participation
A broker routes orders to liquidity sources that are temporarily strained

If there aren’t enough counterparties at your intended price, the system has to fill closer to the next available level—which can be worse than expected.

Order Execution Speed and Technology

Even outside major news, slippage can occur due to execution timing. Your order has to pass through several steps: your platform sends an instruction, your broker receives it, routing chooses counterparties, and the execution platform confirms the fill.

If any part of this pipeline delays processing by milliseconds, the market can move a bit in the meantime. That may not matter in slow markets, but it matters in fast markets or for scalping strategies.

Types of Slippage

Slippage can be positive, negative, or zero.

Positive slippage occurs when the executed price is more favorable than the quoted price.
Negative slippage results in a less favorable price.
Zero slippage means the trade is executed exactly at the quoted price.

From a trader’s perspective, zero slippage is never guaranteed—especially when you’re using market orders. Still, understanding these categories matters because it helps you evaluate whether the average outcome is acceptable or if slippage is silently eating your edge.

Impact on Forex Trading

Forex slippage can affect traders of every experience level. The bigger the number of trades, the more slippage accumulates. That’s why the effect shows up loudly for:

Scalpers who target a few pips per trade
High-frequency systems (manual or automated) that place many orders
Traders using tight stop-loss and take-profit levels

When your strategy relies on consistent entry prices, slippage distorts probability. Even if your win rate stays similar, your average win and average loss sizes can change. A few extra pips on entry, and suddenly your risk/reward math looks less… math-y.

Automated trading systems and algorithms also need to be careful. Many of them assume an expected fill structure—especially if they test back in a simulator that doesn’t model real execution costs accurately. If slippage isn’t modeled (or is modeled poorly), the live results can drift.

Strategies to Minimize Forex Slippage

Slippage can’t be eliminated completely because it’s tied to how fast markets move and how orders get filled. But you can reduce how often it happens and how costly it is. Most slippage minimization comes down to three variables: execution quality, order type, and trading conditions.

Choose the Right Broker

Selecting a broker matters more than most traders admit. A broker’s execution model affects whether your orders get routed efficiently and how honestly slippage is reflected in reporting.

Some brokers use execution methods that can reduce the chance of worse fills, while others may show more variation. In general terms, brokers with Electronic Communication Network (ECN) accounts can offer more direct access to market participants and typically provide competitive execution speeds and less slippage. The basic idea is that your order interacts with a pool of liquidity providers rather than only going through a single internal path.

Before opening an account, it’s smart to:

Read the broker’s execution and slippage policy
Check how they define “market execution” for your account type
Look at spread behavior during volatile periods
Test on a demo account, then compare fills on a small live account

Also, don’t ignore the boring reading. “Market orders are executed at the best available price” is common wording and it sounds reassuring until you see how execution behaves during news.

Trade During Optimal Market Hours

Timing affects slippage because it changes liquidity and spread. Trading when the market is busiest tends to reduce the distance between quoted and executed prices.

The overlap between the London and New York sessions is often characterized by higher liquidity and usually less slippage. Meanwhile, the Asian session can be thinner depending on what pairs you trade, which can lead to wider spreads and more price jumps.

A practical approach is to track slippage patterns on your own account. If you notice consistently worse fills at certain hours, that’s useful information—even if the headline “best trading hours” chart says otherwise.

Utilize Limit Orders

When you have the choice, use limit orders rather than market orders.

Limit orders give you control over the price you’re willing to accept. The trade won’t fill unless the market reaches your limit price. This approach can reduce negative slippage because you’re not accepting “whatever next price is available.”

There’s a trade-off, of course. Limit orders can fail to fill, especially in fast markets where price jumps past your level. But for traders who care more about entry precision than guaranteed fills, limit orders are one of the simplest slippage controls.

Use Stop-Limit Orders (When Appropriate)

For strategies that depend on breakout or stop entries, consider stop-limit logic instead of plain stop-market orders. A stop-limit order activates at your stop level, but it only executes within your specified price range.

This can reduce extreme negative slippage during sudden spikes, because the system refuses to fill at a worse-than-acceptable price. The drawback is that it can miss the entry entirely during violent moves—again, not always a problem if your plan allows it.

Monitor Economic News

Economic news is one of the most predictable sources of slippage, even if it’s still not predictable in timing down to the millisecond.

Major announcements can cause sharp price movements, widened spreads, and sudden liquidity shifts. If you trade around news, slippage can spike simply because the market reprices quickly.

A common risk-management setup is:

Avoid new market entries shortly before and during high-impact releases
If you trade those times, use order types that reduce “worst fill” exposure (like limits)
Reduce position size during scheduled volatility, just so your account doesn’t do parkour

If you’re not sure which events matter, start with the high-impact categories: central bank rate decisions, CPI, jobs reports, and surprise statements.

Broker Execution Testing: A Practical Way to See Slippage

If you want to stop arguing with theory and look at reality, run a small execution test:

Take notes for a specific pair (for example EUR/USD) and a specific time window.
Place a set of market orders of the same size.
Compare expected quoted price vs actual fill price.
Log the difference in pips, and calculate the average and worst-case.

Do this for a normal session and a high-volatility session. You’ll quickly see whether your slippage problem is occasional and controllable, or structural.

Conclusion

Slippage is an unavoidable aspect of forex trading, but it doesn’t have to be a mystery tax that you keep paying. By understanding the causes—volatility and liquidity—and using practical controls like a solid broker choice, trading during liquid hours, and order types like limit orders, you can reduce slippage’s impact on your overall performance.

Most importantly, slippage management should be part of your strategy, not an afterthought you notice when your results look off. When execution conditions are factored in, your strategy becomes easier to trust, and your risk calculations stay closer to reality.

Through comprehension and adaptation, traders can better manage slippage and refine their approach to risk. Aligning trading practices with market conditions and broker capabilities improves consistency, even when the market is doing its usual best impression of a rollercoaster.

Slippage vs Spread: They’re Related, But Not the Same

Traders often mix up slippage and spread because both affect your execution cost. They’re connected—especially during volatility—but they describe different things.

Spread

Spread is the difference between the bid and the ask prices at any moment. It’s visible on your trading platform all the time. When volatility rises, spreads often widen, which immediately makes entries and exits more expensive.

Slippage

Slippage is the difference between the price you expect at order placement and the price you actually get at execution. It’s about movement between “send” and “fill.”

A simple way to remember it:
Spread is the cost you see.
Slippage is the cost you sometimes get.

During fast markets, you can experience both: spreads widen and price moves between your quote and fill. That combination tends to hit especially hard for short-horizon strategies.

How Slippage Affects Backtesting and Strategy Performance

Backtesting is where dreams often happen. And then live trading arrives with receipts.

Why Backtests Miss Slippage

Many backtests use historical prices without modeling real execution behavior. If the simulator assumes mid-price fills or uses a fixed spread, it may ignore the “gap” between expected and actual fills. As a result, your backtest might show smooth execution and consistent trade results.

In real trading, you may see:

Worse entries due to negative slippage
Different stop-loss triggers because fills happened at less favorable prices
Take-profit exits that occur earlier or later than expected

Even if your backtest uses a realistic spread, slippage can still cause performance drift. That’s because spread deals with the bid/ask gap at one moment, while slippage deals with price changes over execution time.

What to Do About It

If your platform or strategy tooling allows it, improve your backtesting by adding slippage assumptions. You can estimate slippage from your own account logs. Then, set slippage ranges by time of day and volatility level.

One practical approach:
Collect fill data for a few weeks.
Calculate average slippage and worst slippage for each session type.
Use those numbers in your backtest model (even a simple range works better than zero).

Your goal isn’t perfect simulation. It’s better realism, so you don’t end up surprised when the live account behaves like the real world.

Measuring Slippage: What Numbers Actually Matter

You’ll get more useful insights if you track slippage in a consistent way. Otherwise it becomes a feeling, and feelings don’t rank well on search engines.

Track Slippage in Pips (Not Vibes)

For most forex pairs, measure slippage in pips and record it per order. Also keep the currency pair and order type.

Example metrics you can use:
Average slippage in pips
Count of negative slippage orders vs positive
Maximum observed adverse slippage
Slippage differences between market orders and limit orders

Track It by Session and Volatility

Slippage during a major news release can be several times higher than slippage during a calm afternoon. If you lump everything together, you’ll miss patterns.

Separate your data by:
London/New York overlap vs other hours
High-impact news windows vs normal windows
Pairs with higher liquidity vs less-traded pairs

Once you segment the data, your conclusions stop being vague. You can decide, for example, that your strategy is fine in normal hours but needs changes around specific releases.

Broker and Execution Models: Why They Change Slippage

Different execution setups can change how your orders are treated. Even without diving into overly technical detail, you can still make practical decisions.

Market Execution vs Limit Execution

Market execution is the area where slippage most commonly appears. You’re essentially saying: “Fill me now at the best available price.” If the price moves before your order locks, you may end up with a fill that wasn’t your initial hope.

Limit execution is different because you specify the price. That reduces negative slippage, but it also reduces your probability of getting a fill.

Routing and Liquidity Pools

Where your order is sent matters. If your broker routes orders to multiple liquidity providers and tries to find best price quickly, you may see lower slippage. If routing is slower or depends heavily on less flexible counterparties, slippage can rise.

This is another reason broker testing helps. Two brokers can quote the same spread, but fill at different prices during volatile periods due to different internal handling and routing.

Trading Tactics That Reduce Damage When Slippage Hits

Even if you minimize slippage chances, it will still happen. So it helps to design tactics that handle it without blowing up risk control.

Widen Stops Carefully (and Then Recheck Risk)

Some traders widen stop-loss levels to absorb slippage. That can reduce the rate at which slippage causes an early stop-out, but it changes your risk per trade.

If you widen the stop by 2 pips, you also need to adjust position size so your account risk stays constant. Otherwise, you traded slippage problems for size problems. Those are not the group chats you want to join.

Reduce Position Size During High Volatility

If your system indicates you’ll face higher slippage during certain times, lower the size. This makes the “worst possible fill” less damaging.

It’s not about being fearful. It’s about matching your risk budget to real conditions. A smaller position during red-hot volatility often performs better than a big position that gets stopped by execution noise.

Avoid Overtrading Around Execution-Sensitive Moments

If your strategy triggers too many entries when the market is unstable, slippage will become a recurring cost. Consider adding filters based on volatility or spread.

A simple filter is to avoid trading when spreads are unusually high compared to the pair’s recent average. While this doesn’t directly prevent slippage, it often reduces negative fills because liquidity is failing less often.

Positive Slippage: The Part Traders Don’t Complain About (Too Much)

Positive slippage can feel like free money. And sometimes it is. But it’s not something you should plan your strategy around.

Positive slippage tends to occur when:
Your order references a price that becomes better before execution.
Liquidity improves quickly.
The market reverses slightly during the execution delay.

If you build a system that assumes positive slippage regularly, you’re betting that your future executions will line up nicely. In practice, slippage is random enough to make that expectation unreliable. Track it, don’t worship it.

Negative Slippage and “Slippage Disputes”: What to Do

Sometimes traders believe the broker is acting unfairly. Before you start yelling at customer support, do a few checks.

Check the Order Type and Expected Price

If you used a market order, negative slippage is possible by definition during fast moves. If you used a limit order and it filled elsewhere, then you should investigate.

Also check whether the platform showed a price from “last tick” or a cached quote. Some platforms display quotes that can lag in fast conditions.

Review Execution Logs

Most platforms can show an order history with:
Order submission time
Fill time
Requested price and executed price

If you compare those timestamps against known news events, you can often explain slippage just from market behavior. If slippage is repeated even during calm periods, it’s time to test with another account or another broker.

Set Expectations With Your Broker

A good broker explains how market execution works, what slippage ranges are typical, and how they handle liquidity routing. If the answer is evasive or unclear, that’s useful information too.

Slippage Scenarios by Strategy Type

Different strategies “feel” slippage differently. Here’s the practical version.

Scalping

Scalping lives and dies by tight spreads and tight execution timing. One or two pips matters a lot. Negative slippage on entry can eat an entire portion of your take-profit target. It also changes your stop-out frequency.

For scalpers, slippage control usually means:
Choose brokers with strong execution quality
Prefer limit-based entries when possible
Trade during liquid hours

Intraday Swing Trading

Intraday systems tend to have wider targets than scalping, so slippage often matters less per trade. But it still affects risk. Poor fills can alter stop placement and reduce reward efficiency, especially when trades cluster during volatility spikes.

Filters based on time of day and news can help a lot.

Position Trading

Position trades typically use larger stop distances and longer holding periods. Slippage is less likely to dominate performance. Still, if you place large orders during volatile sessions, fills can vary. It’s less common to “lose the thesis” from slippage here, but it can distort exact entry levels.

Common Questions About Forex Slippage

Can I completely eliminate slippage?

No. As long as you trade in live markets and place orders that require execution through time, slippage can happen. What you can do is reduce frequency and reduce the worst-case impact.

Does slippage only happen with market orders?

Most slippage discussions involve market orders because they rely on immediate execution. Limit orders reduce the chance of getting a worse price than planned, but they don’t remove execution variability completely in every situation. Stop orders can also produce an “execution vs stop level” difference during fast moves.

Is slippage always bad?

Technically, no. Positive slippage is good. But you shouldn’t assume it will consistently happen. Over time, both positive and negative slippage will show up. What matters is the average impact and how it compares with your strategy’s expected edge.

Building a Slippage-Resilient Trading Plan

Slippage management doesn’t need to be complicated, but it does need to be consistent. If it’s random in your approach, slippage will feel random in your results.

Decide How Much Execution Error You Can Tolerate

Before trading, determine whether your strategy can handle a few pips of execution variance. If your take-profit is smaller than typical slippage during your trading window, your plan needs adjustment.

Use a “Fill Quality” Habit

Make slippage tracking part of your regular review. Look at:
Which order types caused negative slippage
At what times it spikes
Which pairs suffer more
Whether slippage matches market volatility

This is less about building stats for bragging rights and more about protecting your future decisions.

Adjust Position Sizing Instead of Pretending Everything Is Perfect

If slippage is unavoidable in certain conditions, size down. Your account will thank you later. A stable risk curve beats occasional hero trades that only worked because the market was in a good mood.

Final Thoughts on Forex Slippage

Slippage can be annoying, especially when you’re doing everything “right.” But it’s also a normal part of how live markets execute orders under changing conditions. The market is moving, your order has latency, and liquidity availability changes minute by minute. Once you accept that, slippage stops being a conspiracy and starts being an engineering problem you can manage.

Understanding slippage means you can make smarter choices about broker selection, trading timing, and order types. It also means your backtests become more realistic and your live expectations become more grounded. And while you can’t delete slippage from forex trading, you can absolutely reduce how much it hurts your edge.

How to Avoid Forex Trading Mistakes That Cost Money

How to Avoid Forex Trading Mistakes That Cost Money

Understanding Forex Trading Risks

Forex trading is the business of buying one currency while selling another, often across very different economies that don’t move at the same speed. That’s what makes it interesting, and also what makes it risky. Prices can shift on a headline, a surprise interest-rate decision, or even a rumor that spreads through markets before the “official” news catches up. For anyone who expects smooth progress, forex will correct that expectation quickly.

The important part isn’t fear. It’s recognition. When you understand the main sources of risk, you can set up your trading process so the risks don’t quietly eat your account. This article breaks down the biggest risk categories that trip traders up, why they happen, and what you can do to reduce the damage.

Lack of Knowledge and Experience

A lot of traders lose money before they ever place a proper trade. They start trading because the charts look readable, or because someone online showed a profit screen without showing the full sequence of losing trades. The forex market doesn’t operate on motivational quotes. It operates on liquidity, expectations, economic data, central bank policy, and risk sentiment.

When knowledge is thin, traders tend to treat forex like flipping a coin and then react emotionally when it doesn’t land on the same side twice. They misunderstand spreads, confuse pips with profit, and don’t realize how leverage interacts with their risk exposure. They also often overestimate how quickly they can learn. A few weeks of watching price action is not the same as developing a repeatable method.

The practical move here is straightforward: spend time learning how forex actually works. Start with the basics: currency pairs, how quotes work, what a pip is, how margin and leverage work, and why spreads matter. If you want a structured place to begin, educational resources like educational resources can be helpful for building a foundation instead of collecting random “bits” of advice.

Learning isn’t just theory, either. You should test ideas with small stakes or a demo account first. The point is to discover where your assumptions break. For example:
– You believe your stop-loss will protect you, but you forget slippage can happen.
– You believe a strategy will work “on any timeframe,” but you never checked performance across different conditions.
– You think you can trade during major economic releases comfortably, but volatility spikes and your entries slip.

A trade journal later might show you “bad luck.” In reality, it’s usually “bad preparation.”

Ignoring Risk Management

Risk management is the part of trading that feels boring right up until it saves your account. Then it becomes the most interesting topic in the room. A trader who understands market analysis but ignores risk management often ends up correct about direction and still loses money because position sizing was wrong, stops were too wide, or the trade was too large relative to the account.

In forex, the damage can be fast because leverage can turn a small move into a meaningful loss. That’s why risk management should be built into your rules before you enter the market, not decided after you’re already down.

One of the most basic tools is the proper placement of stop-loss orders. Stop-loss orders aren’t there to make you feel safe; they’re there to define your loss in plain numbers. Without that, you’re not trading—you’re “hoping with math.”

A common guideline is risking no more than 1-2% of your trading account on any single venture. This isn’t magic, but it prevents a string of normal losses from turning into account failure. If you risk 5-10% per trade, you’re effectively betting that you’ll be right more often than the market allows.

Position sizing is where many traders quietly fail. They see a setup on the chart and automatically choose a lot size that feels “reasonable,” without calculating what their stop-loss distance means in dollars. Tools such as position sizing calculators help translate your plan (stop distance) into your execution (trade size). When sizing is correct, your risk stays consistent even if volatility changes.

It’s also worth planning for the real world. Even with a stop-loss, markets can gap or move quickly. You might receive a worse price than your intended stop. That’s not a reason to skip stops—it’s a reason to keep your position sizes conservative so you can survive imperfect fills.

Emotional Trading

If you’ve ever watched a chart move in your favor for a few minutes and then felt weirdly tense, you already understand emotional trading. Emotions show up in predictable ways: fear makes you exit too early, and greed makes you hold too long. Confidence becomes overconfidence. A small win becomes a justification for larger risk. A larger loss becomes a reason to “get it back.”

Emotions are not the enemy. Acting on them blindly is. The market will keep doing market things: pulling back, ranging, trending, spiking on news, and then doing something you didn’t expect six minutes ago. Your job is to respond with process, not feelings.

One practical countermeasure is to write a detailed trading plan and follow it. A plan should include:
– Your criteria for entering a trade (what you see, where the setup is valid)
– Your stop-loss placement rules (what invalidates the trade)
– Your take-profit logic (where you intend to exit)
– Your max risk per trade (and max loss per day or week if you want to go further)

When those rules exist on paper, you’re less likely to improvise when the trade starts going sideways. Sideways is where emotions tend to multiply. People want certainty, but markets rarely give it in a neat little package.

Light discipline also helps in the moment. If you know your plan says “no moving stops,” you won’t suddenly decide the stop is “just a suggestion.” That alone can prevent some of the most common account blow-ups.

Overleveraging Positions

Leverage is basically borrowing power. It can multiply profits when you’re right, but it multiplies losses when you’re wrong. The problem isn’t leverage itself—it’s using it without respect for how quickly forex can move.

A common rookie mistake is treating leverage like speed. People think, “If I use more leverage, I can recover faster.” In practice, higher leverage usually makes you recover faster in the sense that it also speeds up account degradation.

When you overleverage, you effectively reduce the room for normal market noise. Minute-by-minute fluctuations that would be survivable at lower risk become dangerous when your position size is too large. You get stopped out more often, and then you try to win back losses with bigger risk. That pattern is how “one good idea” turns into a permanent hole.

So the rule is simple: use leverage responsibly and inside your personal risk tolerance. If you’re not sure what your risk tolerance is, figure it out the boring way—by calculating the maximum loss you can handle without panicking.

A helpful mental model is to imagine you’re trading without leverage. Ask: “If this were a smaller position, would I still feel comfortable with my stop-loss and timeline?” If the answer is no, your leverage is doing too much work.

Also note that leverage requirements can change depending on your broker and account type. Don’t assume every account uses the same leverage ratio. Check the contract specs and margin requirements.

Inadequate Market Analysis

Forex is not random, but it is messy. Prices respond to information, positioning, and liquidity conditions. If you don’t analyze what drives price, you’ll end up reacting to movement rather than understanding it.

“Inadequate market analysis” doesn’t only mean using the wrong indicators. It includes:
– Trading without a timeframe context (chasing entries on a chart that isn’t consistent with the broader trend)
– Ignoring economic calendars (and then getting hit hard during news releases)
– Treating technical signals as guarantees
– Confusing correlation with causation (two pairs move together, so you assume they’ll keep doing it)

Most traders benefit from combining technical analysis and fundamental analysis, or at least understanding when each one matters more.

Technical analysis uses price data—charts, trends, support/resistance, moving averages, momentum indicators. It helps answer: “Where is the market likely to react?” and “How is price behaving right now?”

Fundamental analysis uses macroeconomic information—interest rate expectations, inflation trends, GDP releases, employment data, and central bank statements. It helps answer: “What does the market believe about the currency’s future?”

You don’t have to be a macro economist to do this. The trick is to stay consistent. If you decide to trade technical setups, still be aware of the next high-impact news event that could override your chart pattern. Conversely, if you trade around fundamentals, you still need to plan how the market might behave after the news—sometimes the first reaction isn’t the full move.

Failure to Keep a Trading Journal

Trading journals are oddly unpopular until someone’s account stats start haunting them. Then suddenly everyone wishes they’d written things down earlier.

A trading journal helps in two major ways. First, it gives you feedback based on reality. Second, it reveals your patterns—especially the patterns you don’t notice while emotions are running high.

A good journal doesn’t just record “bought here, sold there.” It records why. That means:
– Entry and exit time and price
– The rationale behind the trade (setup type, analysis used, market conditions)
– Stop-loss placement reasoning
– Position size and risk per trade
– Performance results (profit/loss) and whether the trade followed the plan

After a few weeks or months, you’ll start spotting recurring mistakes. For example, you might notice that you lose most often when you enter late after price breaks support. Or you might learn that your strategy works only when spreads are tight. Or you might discover you ignore your journal during high volatility, which is basically “self-sabotage with a diary.”

Regularly reviewing the journal helps you refine decision-making. Maybe you adjust your entry trigger, or you reduce trading frequency on certain sessions, or you change which pairs you focus on. The point is not to eliminate all losses—it’s to reduce avoidable ones.

It’s also a sanity check. Some traders assume they’re “always right.” A journal proves whether that’s true or whether they’re just remembering wins and forgetting the bruises. Markets are expensive teachers, so at least make the lesson more efficient.

Choosing Unreliable Brokers

Broker risk is real, and people underestimate it because the broker often disappears behind the trading platform interface. In theory, the “market” should be the market. In practice, execution quality, spreads, and reliability vary.

Choosing a broker that is regulated by a respected authority matters because it adds oversight. Regulators can impose rules about capital, account protections, and conduct. Regulations vary by region, so you should verify the regulator listed by the broker and understand the protections that apply to your account.

After regulation, execution quality is next. You want consistent spreads, reasonable commissions if applicable, and stable platform performance. Check things like:
– How often the platform freezes during high volatility
– Whether quotes are “sticky” (delayed or changed prices)
– How slippage tends to behave during fast moves
– Withdrawal and deposit reliability

You can also evaluate practical details like customer service. When things go wrong, you don’t want a support ticket that takes three days and sends you in circles. Quick, clear responses matter when you’re trying to manage risk in live markets.

Also, read the fine print about trading conditions. Some brokers may have higher spreads around news or may impose additional constraints on stop orders. If you trade certain sessions or rely heavily on tight stops, these details can matter more than you think.

A good broker won’t automatically make you profitable. But a bad broker can make your trading decisions meaningless by breaking execution.

Other Risks Traders Often Miss

The original risk categories cover the big ones, but there are a few additional problems that quietly show up in real trading.

Market Volatility and News Events

Forex prices can shift rapidly around scheduled events like central bank announcements, inflation reports, and employment data. Even traders with solid analysis get caught when they assume volatility will behave. It rarely does.

When you trade through major news without a plan, you risk having your stop-loss executed at a worse level than you expected. Some traders avoid news entirely. Others trade only certain pairs or time windows. Either way, the key is having a rule.

A sensible approach is to check an economic calendar, then decide:
– Will you trade before the event, during it, or after it?
– If you trade, how will you adjust your position sizing?
– If you don’t trade, what’s your standby plan so you don’t “borrow trouble”?

Spread and Trading Costs

Spreads are the most common cost in forex trading. They’re also the cost many traders treat like a rounding error. A strategy might look profitable on a chart, but if your entry rate is high and your average stop distance is short, spread and commissions can eat the edge.

This is especially true if you trade frequently or on sessions where liquidity is lower. You might be correct in direction but still lose money after costs. The fix is not to avoid trading—it’s to confirm your backtests and forward tests include realistic spreads and limits.

If you’re experimenting, track net results. “Gross profit” and “real profit” are not the same thing.

Slippage and Execution Latency

Even if you place a stop-loss, you’re still subject to how quickly your broker (and liquidity providers) execute your order. In fast markets, there can be slippage. That means you get filled at a different price than expected.

Execution latency (delay) can also matter if your strategy depends on precise entry timing. Trend strategies might tolerate it better than short-term scalping strategies. That’s not a moral judgment, just physics.

So your trading approach should match your execution conditions. If you’re trading short timeframes, choose a broker and setup that handle fast execution. If your execution isn’t great, adjust your strategy so it’s less sensitive to minor timing differences.

Overtrading and Rule Drift

Overtrading usually shows up after the trader gets bored or emotionally restless. They feel like they should “do something,” and then they take setups that don’t meet their own standards. The plan disappears quietly.

Rule drift is what happens when you keep trading but gradually loosen the rules. At first, the deviation seems harmless: a slightly larger position, a stop placed a little wider, a trade taken one timeframe lower. Then one day you look at your journal and realize your “strategy” is no longer the same strategy from the beginning.

Borrowing a phrase from adult life: if you want consistency, you have to manage your impulses. Trading doesn’t reward random activity. It rewards repeatable behavior over time.

Time Horizon Mismatch

Some traders build strategies based on one timeframe, then execute on another. Or they plan to hold for days but exit after a few hours because the trade hasn’t moved enough yet.

This is a risk because it creates inconsistencies. A trade setup might be designed for a swing move, but if you manage it like a scalp, you often cut winners early and hold losers longer than planned.

Your trading plan should include a time horizon expectation. If you don’t like waiting, consider strategies designed for shorter durations—just be honest about what that implies for volatility and costs.

How to Reduce Forex Trading Risks in Practice

The best way to reduce risk isn’t just thinking about it. It’s turning risk control into habits.

Build a Risk Framework Before Trading

Start with account-level rules. Decide what maximum drawdown you can tolerate. Decide how much you’ll risk per trade. Decide whether you’ll stop trading after a certain number of losses, or after hitting a daily loss limit.

Then write these rules down. If you can’t describe your risk framework in one paragraph, it’s probably too vague to follow when things change.

You can keep it simple. Risk management doesn’t need to be complicated to work. Complicated rules fail more often because you don’t remember them under stress.

Use Stops, but Place Them with Reason

A stop-loss should be tied to market structure or invalidation, not just “some number of pips away.” If your stop is arbitrary, you’ll get stopped out in situations where the setup is still valid, or you’ll place it so wide that your position size becomes too large.

When you place stops based on invalidation, you’re making the trade’s logic testable. That makes it easier to maintain discipline. If the market hits your stop, your trade was wrong according to your plan. That’s it. No drama required.

Size Positions to Match Your Stop Distance

This is where the position sizing calculator earns its keep. Your lot size should be based on:
– Your risk percentage (like 1-2%)
– Your stop-loss distance (how far price can move against you)
– Your account currency and the pair’s pip value

Even if your analysis is excellent, wrong sizing can ruin it. Good sizing keeps your risk steady so you can evaluate your strategy fairly.

Match Your Trading to Your Schedule and Attention Span

Traders who work full-time usually don’t have all day to watch charts. That constraint is not a weakness; it’s a parameter. If you can only check markets once or twice per day, avoid strategies that require constant monitoring.

If you do watch constantly and still mismanage, that’s a different issue—one that usually involves emotional trading or rule drift. But either way, don’t pretend your lifestyle can magically support your trading plan.

Use a Journal Like a Feedback Loop

A journal becomes useful when you do something with it. Don’t just fill it in. Review it regularly and adjust based on evidence.

If your journal shows that you consistently lose trades in a certain scenario, then either avoid that scenario or adjust how you trade it. That might mean waiting for confirmation, reducing size, or changing timeframe.

If your journal shows you’re mostly losing due to execution issues (late entries, oversize, ignoring stops), that’s also useful. It tells you what needs fixing. Not every problem is a “market” problem. Sometimes it’s a process problem.

Be Selective About the Pairs You Trade

Some currency pairs behave more predictably than others. Liquidity also varies across pairs, which affects spreads, volatility, and slippage.

If you keep switching pairs whenever you feel impatient, you add complexity. Each pair has its own rhythm. Sticking to a set of pairs long enough to learn their behavior can reduce decision errors, and that lowers risk even if your entry and stop rules stay the same.

Understand the Costs and Execution Quality of Your Broker

If your broker has wide spreads during the hours you trade, your edge may vanish. If withdrawals are slow or support is unresponsive, you’re increasing operational risk. That’s not theoretical—it shows up when you least want extra stress.

So treat broker selection like part of your risk management. It deserves the same attention you give to your trading strategy.

Forex Risk Scenarios You Can Plan For

It helps to visualize how risks show up when you’re trading, because it’s easy to underestimate them in the abstract.

Scenario: You See a Good Setup, Then News Hits

Your analysis might be correct, and the price might still move your way later. But right now, volatility spikes and your stop-loss gets hit. In that case, your problem isn’t “bad luck,” it’s incomplete risk planning around event timing.

Workaround options include pausing during announcements, reducing position size into the event, or waiting for volatility to settle before entering.

Scenario: You Take a Small Loss, Then Take Another That Breaks Your Rules

This is the start of revenge trading. The market didn’t change your intelligence; it changed your emotions. After the second loss, you might widen stops or increase size without noticing. Your journal will show the exact point where discipline slipped.

Your fix is to have a clear rule for after-loss behavior: stop trading for a set amount of time, or reset to a strict risk plan for the next trade. The market will still be there later. Your account might not be, if you keep forcing it.

Scenario: You Think Your Stop Is Safe, but Execution Isn’t

Even solid stop placement can be affected by slippage during fast moves. That’s why your stop placement and your position sizing should assume you might be filled slightly worse than expected.

Conservative sizing is the antidote. It lets you absorb imperfect fills without turning one mistake into a catastrophe.

Conclusion

Forex trading is risky, but it’s not chaotic. The risks come from recognizable sources: insufficient knowledge, careless risk management, emotional decision-making, leverage misuse, weak market analysis, execution problems, and operational issues like broker reliability. When you treat risk as a system rather than a feeling, you give yourself a real chance to stay in the game long enough for your edge to matter.

If you take only one practical lesson from all this, let it be this: protect your account first, then try to improve your strategy. A trader with consistent risk control can survive while they refine entries. A trader who ignores risk control can be “right” on direction and still lose everything before refinement ever happens.

And if you’re thinking “yeah, yeah, I’ll do that later,” consider the market’s sense of humor: it doesn’t wait for your future plans. It just moves. So set up your process now, document what happens, and trade like the math matters—because it does.

The Impact of Interest Rate Differentials on Forex Trading

The Impact of Interest Rate Differentials on Forex Trading

Understanding Interest Rate Differentials

Interest rate differentials matter in forex trading in a way that’s hard to overstate. They sit behind a lot of the “why did this currency move?” questions traders end up asking—sometimes right after they’ve missed the move. At a basic level, an interest rate differential is the gap between the interest rates of two countries. That gap shapes how attractive each currency is for investors, and the forex market tends to react when that attractiveness changes.

When one country’s interest rates are higher than another’s, investors typically prefer holding assets in that higher-yielding currency. In practice, they may buy that currency (or buy assets priced in it), which increases demand and can push the currency upward. The opposite can happen when the yield advantage shrinks or disappears.

It’s not magic, and it’s not guaranteed. Currency values can move for many reasons (growth expectations, risk sentiment, trade flows, geopolitics). But interest rate differentials are a strong driver—especially over medium time horizons and in strategies that explicitly rely on carry.

The Mechanics of Interest Rate Differentials

Interest rate differentials are usually generated by central bank policy differences. Each central bank sets a target for short-term interest rates (or an equivalent policy rate). Those rates then filter into the money-market rates that investors actually earn.

Here’s a simple example. Assume the Federal Reserve in the United States sets an interest rate of 2%, while the European Central Bank sets theirs at 1%. The interest rate differential is therefore 1% (2% minus 1%).

Investors don’t just look at today’s differential, though. They also care about what the differential is expected to be tomorrow, next month, and by the time any position unwinds. That’s where expectation becomes as important as the current number. A currency can strengthen before a central bank decision if market pricing shifts toward higher future rates—or weaken if the market starts expecting cuts.

How Forex Turns Interest Into Price

Forex is essentially the price of one currency in terms of another. If investors believe that buying one currency will yield better returns, they may increase demand for that currency. Increased buying pressure can lift the exchange rate.

A helpful way to think about it:

– Higher relative interest rates make the currency more attractive to hold.
– Increased demand can lead to currency appreciation.
– Appreciation can combine with interest earnings to improve the trade’s results.

If this sounds similar to bond investing, you’re not imagining things. Many forex trades behave like a cousin of fixed income: a return stream exists (the interest differential), and the exchange rate can either help or hurt.

Implications for Forex Traders

For forex traders, interest rate differentials often show up in two ways:

1) As a direct ingredient in carry-oriented strategies
2) As a background factor that influences which currencies tend to outperform over time

Currencies with higher interest rates often become the “funding target” for investors who want yield. Traders may position for either continued rate advantage (and possible appreciation) or for a narrowing differential (and potential depreciation of the high-yielding currency).

Carry Trade: Where Differentials Earn Their Keep

A common approach that uses interest rate differentials is the carry trade. The mechanics are straightforward in concept:

– Borrow in a currency with a lower interest rate
– Convert into a currency with a higher interest rate
– Invest or hold the higher-yielding currency
– Earn the interest differential, ideally riding along exchange rate moves that don’t ruin the party

In real markets, the borrow-and-lend comparison isn’t always a literal bank-to-bank transaction for a retail trader. But the economic idea is the same: where you have a yield advantage, the position can earn over time.

A mild joke most professionals have heard at least once: “The market will pay you interest… until it doesn’t.” That’s the core risk in carry.

Risks Associated with Interest Rate Differentials

The biggest trap is assuming that a higher interest rate automatically means profits. Exchange rates can move sharply, and those moves can overwhelm the interest you’re earning.

For example, if you’re long a higher-yielding currency expecting a gradual grind upward, but risk sentiment flips or a policy outlook changes, the currency could drop quickly. The resulting exchange-rate loss might exceed the interest differential earned, turning the trade negative.

Other risk factors include:

– Sudden central bank shifts (rate hikes or cuts earlier than expected)
– Inflation shocks that force rapid policy changes
– “Risk-off” episodes that cause investors to unwind leveraged positions regardless of yield
– Liquidity changes that widen spreads and reduce the efficiency of exits

The point: treat interest rate differential as one input, not a whole thesis.

Staying Informed

Interest rates don’t sit still, and markets rarely wait for you to catch up. For forex traders, monitoring central bank communication is as important as the rate itself. Statements, minutes, economic projections, and press conferences often shift market expectations before any actual change happens.

This is also where geopolitical events matter. A country can technically “look fine” on inflation and growth, but if political risk rises and investors demand less exposure, the currency can weaken even if the central bank hasn’t changed policy.

Many traders rely on forex trading platforms for real-time rates, economic calendars, volatility metrics, and research tools. In practice, it helps to have alerts set for policy decisions, major macro releases, and high-impact data. You can’t trade what you don’t see—though yes, plenty of people try.

To be clear, interest rate differentials hold meaningful sway in forex outcomes. Traders who incorporate them—alongside risk management and macro awareness—usually make better decisions. Those who ignore the differential entirely may still trade profitably, but they’re missing an important piece of the puzzle.

What Drives Interest Rate Differentials?

Interest rate differentials don’t happen randomly. They’re the result of central bank policy decisions, which themselves react to a set of macroeconomic conditions. If you understand what central banks respond to, you’ll understand why differentials widen and narrow, and you’ll be less surprised when currency performance changes.

Central banks typically look at inflation trends, economic growth, financial conditions, labor market signals, and stability concerns. Traders don’t have the central bank’s internal model, but the public version is close enough to make real trading decisions—if you watch it consistently.

Inflation and Economic Growth

Inflation is usually the biggest driver. Central banks set policy rates partly to control demand and rein in price pressures. If inflation runs above target, the central bank usually increases rates to cool the economy. If inflation is below target, rates may be cut or kept low to support spending and investment.

Economic growth matters because it influences how strongly the central bank feels it needs to respond. A stronger economy can create demand that pushes inflation higher. Meanwhile, during a downturn, weaker demand can cause inflation to fall, giving the central bank more room to lower rates.

Put simply:

– Higher inflation risk tends to support higher interest rates.
– Lower inflation risk tends to support lower interest rates.
– Strong growth can intensify the inflation response.
– Weak growth can reduce inflation pressure and justify rate cuts.

How Growth Changes the Market’s “Rate Path”

Even when inflation looks stable, growth can shift expectations. Traders track not just actual data, but also forward-looking indicators like surveys, employment trends, and purchasing manager indexes.

This matters because markets often price interest rate paths months ahead. If investors expect the central bank to keep policy restrictive due to growth strength, the yield differential can remain wide longer than expected—supporting the higher-yielding currency.

Conversely, if growth data weakens quickly, a central bank may pivot. The differential starts narrowing in anticipation, and the high-yield currency may underperform before any vote ever happens.

Political Stability

Political stability affects interest rate differentials indirectly, but it can also hit them directly. When governments face uncertainty, investors may demand a higher risk premium for assets in that country. That increased risk premium can show up in bond yields and funding costs, which can influence or constrain central bank policy.

Sometimes central banks can still move rates based on inflation. Other times, they might prioritize financial stability and currency credibility. Foreign exchange markets react fast to credibility questions because currency weakness can amplify inflation.

In practice, traders should watch for:

– Sudden election outcomes or coalition instability
– Policy uncertainty (tax, regulation, central bank independence)
– Capital flow concerns and external financing needs
– Regional tensions that raise risk premia

A stable political environment often supports investment inflows, which can help keep interest rates structurally higher in some circumstances. The reverse is also true: instability can lead to higher volatility and weaker currencies.

Global Economic Trends

Central banks don’t operate in isolation. Global economic trends alter the exchange-rate and funding environment. Major economies influence everyone else through trade, capital flows, and the general “risk temperature” in markets.

For example:

– In global downturns, risk tends to rise and investors shift into safer currencies, regardless of relative yields.
– Commodity price swings can alter inflation outlooks for commodity-linked economies.
– Changes in global liquidity can affect how easily investors fund positions across borders.

A central bank might still want to keep rates high, but if capital flees the country due to risk sentiment, the currency can fall sharply. That can produce a yield differential that looks attractive on paper, yet fails in practice because the currency moves against you.

Supply and Demand for Currencies

Interest rate differentials operate through demand and supply dynamics in foreign exchange. If investors expect higher yields, they may buy the currency. If expectations change, that demand can evaporate quickly.

Supply and demand can also be influenced by:

– Balance of payments flows (trade vs capital flows)
– External funding needs (government and corporate borrowing)
– Hedging demand from multinational companies
– Bank funding costs and capital requirements

This is why attention to currency flow narratives helps. When a currency’s supply demand balance shifts due to funding needs or hedging activity, the exchange rate can move even if the central bank hasn’t changed policy recently.

Putting the Drivers Together

Inflation, growth, political stability, global trends, and money-market supply/demand all interact. That means a widening interest rate differential can be bullish for a currency, but not always.

A practical approach is to ask three questions before assuming a trend will continue:

1) Is the central bank likely to keep widening rates, or is the difference already priced in?
2) Is inflation trending in the same direction as policy expectations?
3) Is the market in a risk-on mood where carry strategies usually work—or risk-off, where they often don’t?

When these answers align, interest differential strategies tend to behave well. When they conflict, expect more price action.

Practical Tips for Forex Traders

Interest rate differentials are useful, but only if you treat them like they belong in a process—not a guess. The best traders tend to systematize the work: identify the differential, understand the “why,” monitor upcoming catalysts, and manage risk tightly.

Below are practical ways traders typically integrate interest rate differentials into their activity without turning every trade into a carry trade fantasy.

Recognizing Favorable Opportunities

Start with recognizing when a differential is likely to matter in the near term. That often depends on upcoming central bank events and high-impact macro releases.

Here’s what tends to create “real” trading opportunities:

– The market has shifted expectations for future policy (not just the current rate)
– A central bank signals a persistent stance (more hawkish than peers)
– Inflation data supports a continued restrictive policy path
– Economic growth continues to justify higher rates relative to peers

To stay consistent, many traders build a routine:

– Track central bank calendars
– Monitor inflation and labor updates
– Watch for guidance changes and official language shifts
– Compare those signals across the two countries in your currency pair

If you only check interest rate levels once a week, you’ll miss the part where markets move daily based on expectations.

Timing: The Part People Skip

Timing is where interest differentials often disappoint. Even if the long-term picture is correct, a position entered too late can face a currency adjustment that already happened.

For instance, if the market has been expecting a rate hike and the hiking decision arrives, the currency might already have strengthened beforehand. In that scenario, the differential may not expand further, and you can end up holding through a period of consolidation—or worse, a reversal if guidance turns slightly less hawkish.

This is why traders often distinguish between:

– Data-driven expectation shifts
– Actual policy events
– Post-event repricing

The post-event phase can still move prices, so don’t assume the “announcement day” is the end of the story.

Diversification and Risk Management

If you’re trading interest differentials, don’t treat it like a single-bet strategy where everything rides on one pair staying friendly. Exchange rates can change abruptly, and carry trades can unwind fast.

Diversification here doesn’t mean owning ten random currencies. It means reducing the chance that one macro scenario breaks your whole plan.

For example, spreading exposure across uncorrelated or differently driven pairs can reduce harm if one currency suffers a policy surprise or a risk-off drop.

Risk Controls That Actually Matter

Interest differential trades can have long holding periods, which is exactly when risk management gets lazy. Don’t.

Basic risk tools still matter more than almost anything else:

– Stop-loss placement that reflects volatility, not hope
– Position sizing aligned with account drawdown tolerance
– Limits on leverage, because carry strategies can feel stable until they’re not
– Plans for what happens if central bank communication contradicts the thesis

A useful mental model: assume the market will eventually correct. The job of risk management is to ensure the correction doesn’t end your account.

Leveraging Technological Tools

This isn’t about having the flashiest charting software. It’s about reducing reaction time and improving information flow when policy events hit. Trading platforms that provide real-time data, macro calendars, and analytics can help you respond faster without guessing.

Practical features many traders rely on:

– Economic calendars with impact ratings
– High-quality historical pricing and volatility measures
– Alerts for policy statements and key data releases
– Position tracking and journal tools for reviewing performance

If you can’t tell after a month whether your interest differential strategy works because of the differential or because of market timing, you’re flying blind. Tools help with the boring part: measurement.

Some traders also use automated systems for entry/exit based on predefined conditions (for example, when a yield differential reaches a threshold and price holds above a volatility-adjusted level). Automation can reduce emotional decision-making, though it won’t prevent wrong assumptions about macro outcomes.

Reviewing Trades Beats Re-reading Theories

After you trade, review what actually happened:

– Did the differential widen or narrow during your holding period?
– Did the central bank guidance match the expectation you based on?
– Was your exit driven by your plan or by frustration?

Over time, this builds real intuition. Theoretical knowledge is fine, but your own data tends to teach faster.

Continuous Learning and Adaptation

Forex markets evolve. Central bank behavior can shift with political changes, inflation regimes, and global financial conditions. A differential that worked well in one decade might behave differently in another.

So you need a learning loop:

– Keep reading macro updates from multiple sources
– Watch how policies in one country influence capital flows
– Learn from periods when carry does poorly (risk-off spikes)
– Adjust your time horizon when market behavior changes

For carry-heavy approaches, paying attention to volatility shifts is especially important. When volatility rises, exchange rate swings can wipe out interest gains quickly.

A Real-World Use Case

Imagine a trader planning a carry position between two currencies: Currency A offers consistently higher yields than Currency B. At first, everything looks fine: inflation in A remains controlled and central bank communication stays hawkish. The differential stays wide.

Then a few months later, inflation in B surprises to the upside. Market pricing starts expecting a tighter policy path for B. The differential begins shrinking, even before any actual rate changes occur.

A trader who only looked at the original yield gap might still feel “right,” but the market has started repricing expectations. At that point, performance depends less on the initial differential and more on whether the trader adjusted quickly when the differential logic changed.

That’s the recurring theme: interest differentials are a useful signal, but expectations shift. Your job is to track those shifts faster than your competitors—or at least fast enough that your risk plan holds.

Interest Rate Differentials, Expectations, and Market Mood

One last piece that’s easy to miss: interest rate differentials don’t operate in a vacuum. The market’s mood—risk-on or risk-off—can dominate whether carry strategies behave well.

On risk-on days, investors often tolerate higher leverage and hold higher-yield currencies, allowing interest differential logic to work more smoothly. On risk-off days, investors unwind positions, sell higher-yield currencies, and move into perceived safety. Even if the yield gap remains attractive, the exchange rate can move against the trade.

This is why two traders can look at the same differential and get different results. The difference is not the calculator—it’s how each trader accounts for volatility and macro timing.

If you’ve ever watched a trade go green slowly, then flip red on a single headline, you’ve seen this in action. Markets love a plot twist.

Conclusion

Interest rate differentials influence forex markets because they shape relative yield incentives across countries. Higher rates in one country often attract capital, supporting currency demand and potential appreciation. That’s why these differentials connect naturally to carry trade concepts, where traders attempt to profit from both yield and exchange rate movement.

But interest differentials also bring risks. Exchange rates can move fast when expectations change or when risk sentiment shifts. A widening differential can already be priced in, and a strategy that ignores central bank communication and volatility can quickly run into trouble.

Forex traders who treat interest rate differentials as a decision-support tool—while staying focused on inflation, growth, policy credibility, global trends, and sound risk management—tend to make more consistent choices. They’re not chasing a single number; they’re trading the relationship between that number and the market’s changing expectations. And yes, that’s the part that keeps it from being as simple as it looks on paper.

What is Forex Hedging and How Does It Work?

What is Forex Hedging and How Does It Work?

Understanding Forex Hedging

Forex hedging is a practical risk-management approach used by traders and businesses when they’re exposed to foreign exchange (FX) movements. In plain terms: if you have money coming in or going out in another currency, FX rates can move faster than your invoicing cycle. Hedging is how you try to avoid getting blindsided by that movement.

Unlike trading, where you’re actively trying to profit from market moves, hedging is usually about protection. It’s the financial equivalent of wearing a seatbelt—not because you expect a crash, but because you can’t control the road. FX prices can shift due to interest-rate changes, inflation surprises, central bank messaging, geopolitical headlines, and even simple market positioning. If your cash flows, costs, or portfolio values depend on exchange rates, hedging exists to reduce the damage when rates move against you.

Concept of Forex Hedging

The core idea behind forex hedging is to manage uncertainty. You can’t stop the market from moving, but you can structure your positions so that losses on one side are offset by gains or reduced losses on the other. That might mean locking in a future exchange rate, buying protection against adverse movement, or using standardized contracts that fix key terms in advance.

Practically, hedging does two things. First, it reduces the “currency risk” component of your results. Second, it helps you make better decisions because your budget or valuation becomes less dependent on the FX market behaving nicely. For a business, that can be the difference between planning confidently and constantly re-forecasting due to every tick in EUR/USD or GBP/JPY. For a trader, hedging can limit drawdowns while keeping exposure to other opportunities.

What counts as “FX exposure”?

FX exposure is the part of your financial outcome that changes when exchange rates change. It can show up in several ways:

  • Transaction exposure: You’ll pay or receive foreign currency at a known time in the future (for example, a customer pays you in USD next month, or you buy equipment in EUR this quarter).
  • Translation exposure: Accounting and reported results change due to converting foreign subsidiaries or assets back into your reporting currency.
  • Economic exposure: Your competitive position can shift over time as currency moves affect pricing, demand, and costs. This one is harder to hedge perfectly, but traders and companies still try.

Most straightforward hedges target transaction exposure because timing and amounts are often more defined. Economic exposure is more like weather forecasting—still useful, but you don’t get guarantees.

Why hedging isn’t the same as “eliminating risk”

Many people assume hedging means “remove all risk.” In reality, hedging usually trades one type of risk for another. If you lock a forward rate to avoid adverse moves, you might give up potential upside. If you buy options, you cap losses but pay a premium. Either way, hedging changes the risk profile. The goal is usually not zero risk; it’s better risk-adjusted outcomes that match your objectives.

Methods of Forex Hedging

Forex hedging can be structured in multiple ways. Some hedges are direct and rate-specific. Others are optionality-based and depend on how much protection you want versus how much cost you can tolerate.

Below are common instruments and how they tend to behave in the real world.

1. Simple Spot Contracts

Spot contracts involve exchanging currencies at (roughly) the current market rate. By themselves, spot trades aren’t a direct hedge strategy against future movement, because you’re acting now rather than protecting a future unknown.

That said, some traders use spot deals in a way that functions like a de facto hedge. For example, if you know you’ll need a foreign currency soon and the exposure is close to settlement, converting early can reduce FX uncertainty. The effectiveness depends on how close your timing is and how much the rate can move between now and when you truly need the currency.

Spot-based hedging is often simplest but can be “timing-sensitive.” If your cash-in/cash-out date shifts, you may end up repeatedly converting or taking new exposure on the remaining time window.

2. Forex Options

Forex options give the holder the right, but not the obligation, to exchange currencies at a predetermined rate before a specified date. Options are popular because they separate “protection” from “participation.” You can cap losses while still potentially benefiting if rates move in your favor.

Options typically come in two forms:

Call options: the right to buy a currency pair at the strike price.

Put options: the right to sell a currency pair at the strike price.

Options strategies matter because different structures fit different exposures. Here are two strategies you’ll see in practice:

  • Protective puts: Often used when you hold a currency exposure that you want to protect against falling rates. You pay a premium for the option, but you gain a defined loss floor if the market moves against you.
  • Covered calls: Common when you’re willing to sell at a strike price if the market moves upward. It can generate income but may limit upside.

For businesses, options are commonly used when certainty is preferred but you don’t want to be fully locked out of favorable rate movement. For traders, options can be part of hedged portfolios, especially where you want defined risk.

Downside: options premiums are a real cost. If FX doesn’t move enough to justify the premium, you can pay for protection you never use. That’s not “bad”—it’s insurance with a price tag.

3. Forward Contracts

A forward contract is an agreement to exchange currencies on a future date at a rate agreed today. For the party that needs foreign currency later, a forward can lock the cost. For the party that expects to receive foreign currency later, it can lock the conversion value.

For businesses, forwards are frequently used to hedge known exposures like upcoming supplier payments, dividends, or revenue receipts. They’re not standardized like exchange-traded futures; they’re typically customized between two parties (often a bank and a company).

How forwards “feel” in practice:

  • If the spot rate ends up worse than the forward rate for your position, your hedge helps because you’re still able to transact at the agreed rate.
  • If the spot rate ends up better than the forward rate, you might lose the opportunity to benefit from the favorable move due to the locked terms.

That tradeoff is the central characteristic of forwards: they reduce uncertainty in exchange for sacrificing some upside.

4. Currency Futures

Currency futures are standardized contracts traded on exchanges. They also settle at a future date, based on a specified price and contract size. Because they’re exchange-traded, they typically involve margin requirements and daily settlement of gains and losses (mark-to-market).

Large institutions often use futures because of liquidity and because trading is governed by exchange rules. Futures can hedge currency risk in a very direct way by locking the exchange rate for the contract period.

Differences versus forwards:

  • Standardization: Futures contracts have set contract sizes and maturities.
  • Daily settlement: Mark-to-market can create cash-flow timing effects even if the economic exposure is longer-term.
  • Margin: You may need to post collateral, which can become a practical constraint.

For many hedgers, futures work well when contract specifications align reasonably with the underlying exposure. If the exposure amount or timing doesn’t match, you may hedge “partially,” which can leave residual risk.

Benefits and Risks of Forex Hedging

Forex hedging has a clear purpose: reduce adverse outcomes from currency volatility. The trick is to do it in a way that doesn’t introduce new problems or costs that outweigh the benefits.

Benefits

Risk Management: Hedging reduces the impact of unfavorable exchange rate movements. This matters in volatile environments—when central banks surprise the market, when political risk increases, or when macroeconomic data changes expectations quickly.

Cash Flow Stability: Businesses with international receivables or payables benefit from predictable cash flows. Better cash-flow predictability improves budget discipline, supports debt planning, and reduces the emotional rollercoaster that comes with constant FX re-forecasting.

Protection without stopping operations: A hedged firm can continue executing contracts with less fear that the final FX movement will erase margin. Traders can also hedge to limit drawdowns while maintaining positions they believe will perform.

Profit opportunities, sometimes: In some cases, a hedge may not only protect but also improve overall performance depending on how positions are structured. If the hedging instrument behaves favorably relative to the underlying exposure, you can reduce losses and maintain better portfolio outcomes. Still, most hedgers should treat profit as a secondary benefit, not the main promise—markets love to humble predictions.

Risks

Cost of Hedging: Hedging isn’t free. With options, you pay premiums. With forwards and futures, there can be indirect costs through pricing, spread differences, financing effects, or margin needs. If you hedge too aggressively or choose an instrument that doesn’t fit the exposure, you can spend a lot to protect against little.

Complexity: Hedging works best when you understand instrument behavior, settlement rules, and how the hedge interacts with your underlying positions. Options pricing, forward points, and futures margin mechanics are not “set and forget.” Even experienced teams benefit from clear procedures and reviews.

Conditional outcomes: Many hedges cap losses but also limit upside. With forwards, for instance, you lock the exchange rate and give up gains if the market moves your way. With protective options, you cap losses but spend premium that could be avoided if the market trends favorably.

Basis mismatch and residual risk: If the hedge instrument doesn’t perfectly match the exposure amount, currency pair, or timing, you’ll end up with basis risk. For example, you might hedge EUR/USD exposure with a contract that doesn’t align with your exact settlement date, or your exposure is in a currency that behaves differently than the one you hedged.

How hedging risk shows up in P&L

Hedging can impact reported profit and loss in patterns that confuse people who only think in “final outcome.” You might see:

  • Mark-to-market effects (common with futures)
  • Premium expense recognition (common with options)
  • Offset on settlement dates (common with forwards)

That doesn’t mean hedging “failed.” It means the accounting and settlement timeline could differ from your operational cash flow timeline. It’s normal—just plan for it.

Implementation Strategies

A “good” hedging strategy depends on how well it matches the specific exposure, not on picking the most popular instrument. Two companies can face the same currency risk and still need different hedges because their cash-flow timing and objectives differ.

1. Assessing Risk Exposure

The first step is getting specific about what’s at risk. Traders look at position exposure. Businesses look at expected receipts and payments, as well as how those translate into accounting currency.

Key questions to answer internally:

  • What currency risks matter most?
  • When do cash flows occur?
  • How predictable are amounts and dates?
  • Is this exposure transactional, translational, or economic?

If your payment date can move by weeks, hedging a single fixed maturity can leave you exposed in the gap. If your receivables are uncertain in size, you may hedge a forecast range rather than a single number, or you may implement layered hedges.

2. Selecting Appropriate Instruments

Instrument selection should match both the exposure and the organization’s tolerance for cost and complexity.

Some practical matching rules:

  • Short-term, known cash flows: Forwards or spot conversion near settlement often fit well because timing is close and uncertainty is lower.
  • Known cash flows but you want flexibility: Options can work because you can protect downside while allowing upside.
  • Need for exchange-traded standardization: Futures can help when standardized maturities and contract sizes align with exposure and margin management is feasible.

Example scenario: suppose a company expects to purchase equipment in USD in three months and wants to cap FX risk but still allow some benefit if USD weakens. A forward locks the rate completely, meaning they lose upside from USD weakness. A protective option structure could better match the “cap downside, allow upside” goal, though at the price of the premium.

Another trader example: someone with a long position in an asset priced in a foreign currency adviser may use options to reduce currency impact without closing the asset position. That keeps market exposure while moderating FX risk.

3. Ongoing Monitoring and Adjustment

FX risk management is not a one-time decision. Exchange rates move and your exposure changes too. Revenues get delayed, expenses shift, contracts get renegotiated, and macro circumstances evolve.

Monitoring should include:

  • Checking how much of the exposure is actually hedged, not just what was hedged at initiation.
  • Reviewing market conditions that might affect hedge effectiveness (volatility, rate differentials, liquidity).
  • Reassessing forecast accuracy for future periods.

Adjusted hedges aren’t always about adding more protection. Sometimes the best action is to reduce an old hedge because the exposure shrank, or to roll contracts forward when maturities approach.

There’s also a human side: if you automate hedging processes (strong idea), you still need someone to check the logic occasionally. Machinery can be right and still apply the wrong assumptions at scale. I’ve seen it happen—usually on a Friday, because that’s when calendars get creative.

4. Balancing Costs and Benefits

A hedging program needs a cost framework. The “benefit” is usually reduced variance in results, but the cost is direct (premiums, fees) and indirect (opportunity cost due to locking a rate, margin needs, operational overhead).

Businesses often define acceptable risk levels. Traders often define acceptable drawdown or maximum loss constraints. In both cases, the cost of hedging should match those constraints.

The main discipline is to avoid hedging every moving target as if nothing changes. Over-hedging can lock you into unfavorable pricing for longer than necessary and waste premiums or reduce flexibility. Under-hedging, on the other hand, leaves you exposed when it counts.

Common hedging styles

Here are three styles teams often use, even if they don’t give them fancy names:

  • Full hedge: Cover the entire forecast exposure amount for a given period.
  • Partial hedge: Hedge a portion (for example, 30–70%) when forecasts are uncertain or when cost control matters.
  • Layered hedge: Build the hedge over time (or in tranches) as exposure becomes more certain and timing details improve.

Layering can reduce the problem of making one perfect hedge decision at the wrong time. It’s not magic, but it’s often more realistic than trying to nail the exact rate on a single day.

Advanced Considerations (without making your head hurt)

Most readers don’t need to become FX option quants to hedge responsibly, but a few concepts help avoid typical mistakes.

Hedge effectiveness and “basis risk”

Hedge effectiveness is how well the hedge instrument offsets the changes in the exposure. Basis risk is the leftover difference between hedge and exposure performance.

Basis risk can come from mismatched timing, different exchange rate conventions, or the fact that the hedge instrument might track the currency pair differently than your actual settlement rate practice. For example, your supplier might apply an exchange rate based on a bank’s published rate at settlement time, which may not match the mid-market spot rate used in your internal calculations.

In real operations, settlement conventions matter. That’s why experienced treasury teams align hedge terms to how transactions actually settle.

Hedging documentation and internal controls

For businesses—especially those that hedge for accounting purposes—documentation matters. You typically need clarity on what is being hedged, how, and why. Internal controls help ensure the hedge aligns with policy rather than impulse decisions based on the latest headline.

Policy helps because FX markets can feel personal in the moment. One strong jobs print and suddenly everyone wants a hedge right now. Controls keep hedging tied to forecast periods and risk limits instead of gut feelings.

Margin and collateral planning (especially for futures)

If you hedge with currency futures, daily mark-to-market can create cash-flow needs in addition to the hedging “result.” A hedge might be economically correct but still cause short-term funding stress because margin calls arrive when volatility spikes.

That’s why margin planning is part of responsible hedging. You can’t treat it like an afterthought.

Volatility and option cost dynamics

Options pricing depends heavily on implied volatility. If markets get more uncertain, premiums can rise. This can create a timing problem: the very moment you most want protection, options may cost more.

Some teams address this by using rolling structures over time or by defining option strategies that match their risk appetite and budget constraints rather than chasing protection only after stress appears.

Practical Examples of Forex Hedging

Let’s make this less abstract. Below are three common “real life” scenarios that map to the instruments discussed earlier.

Example 1: Importer with a known EUR payment

A U.K. importer expects to pay a EUR supplier €1,000,000 in two months. Their costs and revenue are mostly in GBP, so a stronger EUR can squeeze margins.

Possible hedge: A forward contract to buy EUR at a fixed rate on the payment date.

The effect is usually straightforward: the importer trades away potential upside if EUR weakens, but benefits if EUR strengthens. Cash flows become more predictable, which is often the real point.

Example 2: Exporter with USD receivables, wants upside

A Canadian exporter expects USD receivables next quarter, but timing and amounts can shift based on customer schedules. Management wants protection against USD weakening, but also hopes to benefit if USD strengthens.

Possible hedge: A series of FX options (often layered) to provide downside protection while allowing upside participation.

Because the exporter pays premiums, they need to decide whether the cost is acceptable relative to expected benefit. This approach can be a good fit when forecasts are uncertain and management values flexibility.

Example 3: Trader hedging portfolio risk

A trader holds a strategy exposed to currency movements—either through asset pricing or direct FX positions. They want to reduce drawdown risk during volatile periods but keep the ability to perform if their directional view remains correct.

Possible hedge: Futures or options to offset FX exposure while keeping the core position.

Here, monitoring matters. If the underlying exposure changes due to position size changes or partial exits, the hedge must be adjusted accordingly.

Common Mistakes People Make

Hedging can be responsible and effective, but it’s also where mistakes hide in plain sight.

Hedging the wrong period

If your exposure happens in six weeks and you hedge a three-month instrument, you might be paying for protection you don’t use while leaving uncovered exposure elsewhere. It isn’t automatically wrong, but it often shows up as higher costs with less effectiveness.

Using the wrong currency pair or settlement convention

Hedging with a related pair when the exposure’s settlement behavior doesn’t track exactly can create basis risk. Currency pairs don’t always move together in a way that perfectly offsets.

Assuming “set it and forget it”

Markets evolve. Your exposure evolves. A hedge that was perfect at initiation can become mismatched as forecasts change. Ongoing review and rebalancing are what separate a hedge program from a hedge accident.

Not accounting for costs honestly

People sometimes treat hedging costs as negligible until they tally up premiums, fees, and margin cash needs. Hedging costs are real, and they should be part of your decision process from day one.

Conclusion

Forex hedging is a practical tool for anyone exposed to foreign exchange risk—whether you’re a trader managing position volatility or a business stabilizing cash flows for international operations. Proper hedging can reduce the impact of adverse currency moves, improve budget certainty, and help you stay focused on the decisions that actually drive performance.

At the same time, hedging introduces tradeoffs. It can limit upside, involve premiums or fees, and require ongoing monitoring to keep the hedge aligned with actual exposure. There’s no magic version of hedging that guarantees comfort without cost or complexity, but there are well-fitted strategies that make risk more manageable.

In the end, the goal of forex hedging is stability in financial outcomes despite FX volatility. Whether you hedge for a short-term transaction or plan over a longer horizon, the best results come from matching hedge instruments to exposure timing, understanding how the hedge behaves in different market conditions, and reviewing the program often enough that it stays relevant. That’s a dull sentence, but it’s also the truth: FX hedging works best when it’s managed like a process, not a lucky one-time bet.

The Advantages and Disadvantages of Automated Forex Trading

The Advantages and Disadvantages of Automated Forex Trading

Introduction

In recent years, automated Forex trading has grown from a niche interest into something many traders bring up within their first few weeks of learning. New traders like the idea because it seems to remove some of the stress (and late-night screen watching). More experienced traders bring it up because automation can enforce discipline when the market starts doing what the market does best: being unpredictable, loud, and occasionally rude.

Automated Forex trading uses software to execute trades based on pre-set rules. Those rules might be simple (like “buy when price crosses a moving average”), or more complex (like combining multiple indicators with filters and risk controls). Once configured, the system can monitor the market, place orders, and manage positions according to your parameters.

That said, automation isn’t magic. It’s closer to a very fast assistant that follows instructions precisely—even when conditions change. So before you plug an automated strategy into a live account, it helps to understand both what it does well and where it can bite. This article breaks down the real advantages and disadvantages, plus the practical considerations traders often discover the hard way.

How automated Forex trading actually works

Most automated Forex setups fall under one of these categories:

Rule-based trading bots: The system checks market data, applies your rules, and opens or closes trades when conditions match. Think of it like a checklist with timestamps.

Algorithmic strategies: Instead of a single condition, the strategy combines multiple data points—price action, indicators, volatility measures, correlation between pairs, or time-based rules. Slight changes in inputs can create very different behavior.

Copy-trading and signal automation: Some systems mirror trades from another account or follow an external signal source. This can be convenient, but you also inherit the signal provider’s risk profile and execution quality.

All of these have one thing in common: they rely on market data and execution instructions. If the system has inaccurate inputs, gets a bad feed, or the broker execution deviates from the expectation, results can drift quickly. In practice, automation is only as reliable as its logic, data quality, and execution environment.

Advantages of automated Forex trading

Efficiency and Speed: Forex markets move quickly, and even decisions that feel instant to people can take too long to execute when you’re trying to react to small changes. Prices can shift between the moment you notice something and the moment your order actually lands. Automated trading systems reduce that gap dramatically.

A good automation setup can monitor price conditions continuously and then place orders exactly when the criteria are met. That matters most for strategies that depend on timing—breakouts, mean reversion with tight thresholds, or any system that needs consistent entry logic. Even if the strategy’s edge is modest, better execution timing can help avoid “almost entered” situations that later become “missed trade.”

Real-world example: imagine a strategy that enters when a currency pair breaks above a defined level and then returns to a specific confirmation candle. If you’re manually checking charts during the break, you might see the level before the confirmation. If you hesitate, you miss the confirmation; if you click too quickly, you enter before confirmation. Automation can be set to wait for the exact confirmation condition, reducing that human timing mismatch.

Elimination of Emotional Bias: There’s a reason traders talk about psychology so often. Emotions don’t just make you feel bad; they change behavior. Fear can lead you to exit early. Greed can keep you in positions past a point where your plan says you should cut risk. Random frustration can also cause “revenge trading,” which is exactly as helpful as it sounds.

Automated systems follow predefined rules with no fear and no ego. If the system’s logic says “close at this level” or “reduce exposure when volatility expands,” it does that consistently. Over time, this can lead to more uniform execution compared to manual trading, where performance can swing based on mood and recent outcomes.

It’s worth noting a small nuance: automation doesn’t erase mistakes. It just turns them into repeatable patterns. If the strategy rules are wrong or poorly designed, the bot will happily repeat the wrong behavior at 2 a.m. with impressive consistency.

Backtesting Capabilities: Backtesting is where many traders start to build confidence—or to realize they should be far more cautious. When you test a strategy on historical data, you can estimate how it might behave under different market conditions: trending periods, ranging periods, higher-than-normal volatility, and so on.

Backtesting can reveal:

– Whether the strategy’s entry and exit logic produces wins and losses in the expected pattern
– How often the system trades (and whether that fits your time horizon)
– The rough drawdown profile, including whether losses cluster

But backtesting is not a crystal ball. Historical results can differ from future behavior because markets change. Also, backtests can be “fooled” by overfitting (more on that soon). Still, without backtesting, you’re mostly guessing.

24/5 Trading: The Forex market runs continuously during the week, and liquidity shifts by session (Asia, London, New York). Human traders struggle to watch everything at all times, especially if they have a job, family, or a life that doesn’t revolve around candlestick charts.

Automated systems can monitor charts and execute orders during any trading session. That matters for strategies that rely on session timing or specific volatility windows. It also helps traders avoid the “I looked away and it happened” problem—because the system is already watching.

One practical detail: many trading bots need a stable connection and a broker account that supports the order types you plan to use. If your automation runs on a server with frequent interruptions, 24/5 trading becomes 24/5 disappointment.

Disadvantages of automated Forex trading

Technical Failures and Glitches: Automation depends on multiple layers: your platform, your software, your data feed, your device or server, and your broker’s execution. Failure at any point can disrupt trading.

Common problems include:

– Power outages or device sleep/hibernation
– Internet connectivity drops
– Software crashes or memory issues
– Incorrect data responses or delayed market feeds
– Broker downtime or order execution delays
– Misconfigured risk settings (for example, if a stop-loss isn’t attached as expected)

The danger with technical issues is not just that a trade might fail to open. It can also be that orders open but protection doesn’t follow—like a stop-loss not being placed correctly. That’s how a “small glitch” becomes a large mistake.

A serious trader’s mindset here is boring but effective: check logs, monitor your bot’s status, and understand how it reacts to connectivity loss. A robust system should fail in a safe way, such as halting new trades if data stops updating.

Over-Optimization: Over-optimization happens when a strategy is tuned too tightly to historical data. The goal becomes to maximize performance on past charts rather than to create logic that can generalize.

A well-known symptom is when the backtest looks almost too good: high win rate, smooth equity curve, minimal drawdowns. In live markets, that performance often breaks down because the strategy was fitted to noise rather than signal.

There are a few common sources of overfitting:

– Too many indicators and parameters with fine-grained values
– Too much emphasis on short time periods (where random movement can mimic a pattern)
– Trading rules that depend on historical quirks that won’t repeat
– Using one dataset for optimization and another for evaluation without properly validating

Over-optimization also interacts with regime changes. A strategy that worked during a particular market environment can become a liability when volatility compresses, liquidity shifts, or central bank expectations move.

Practical warning: if you can’t explain why your strategy’s parameters should work in multiple market conditions, it’s probably tuned rather than tested.

Initial Setup and Maintenance Costs: Automation isn’t just a one-time download. Even if you use existing tools, you still pay in time and attention—plus possibly in money.

Costs can include:

– Developer time if you’re building a custom solution
– Platform fees or hosting (if you run a bot on a VPS)
– Ongoing maintenance when your broker changes execution rules or platform updates
– Time spent monitoring performance and adjusting logic when a market regime shifts
– Risk management costs when the strategy underperforms and you need to pause or retool

Even “cheap” bots can become expensive if you end up spending hours fixing configuration issues and handling drawdowns while waiting for results that never come.

A realistic approach is to treat automation as a long-term operational project, not a quick shortcut. If you invest the effort upfront—clear risk limits, sensible stop-loss logic, and a plan for when to stop—you reduce the chance of spending months chasing your own configuration errors.

Lack of Human Judgment: Human traders use more than charts. They notice news catalysts, economic releases, central bank statements, and geopolitical shocks. They also consider the “feel” of market sentiment, even if they express it through different lenses.

Automated systems generally won’t interpret news unless you build that into the system. Even then, parsing news reliably is difficult. More importantly, humans can sometimes adapt when the market behaves oddly, while bots might keep trading the same rule set because it still technically meets the criteria.

Here’s the catch: automation can be both disciplined and blind. It can execute your plan perfectly inside its boundaries, but it might still do so during periods you would manually avoid, such as:

– High-impact news events that spike volatility and spreads
– Sudden regime shifts that invalidate the strategy assumptions
– Liquidity gaps where execution slippage increases
– Market conditions where the bot’s indicators lag too much

That doesn’t mean automation should never run during these periods. It means you should deliberately decide how it responds—pause trading around news, adjust risk during high volatility, or add spread filters.

Automation vs. manual trading: where the trade-off really sits

A lot of people treat this as either/or: either you automate everything or you stay manual. In reality, the strongest setups often blend approaches.

Manual trading is good for discretion: you can override the plan if new information changes the scenario. Automation is good for repetition: it enforces consistent execution of a strategy.

A practical hybrid approach might look like this:

– You use a bot for the entry logic and risk controls
– You stay involved for higher-level decisions like “turn off for major news” or “reduce risk after a breakout fails”
– You review performance regularly instead of assuming the bot will improve on its own

This matters because automation can’t “learn” in the common sense unless you build learning logic. Most trading bots don’t truly understand why a trade succeeded; they just repeat a rule that previously worked more often than not. That repetition is useful—until it isn’t.

Risk management: the part automation doesn’t do for you

A common misunderstanding is that deploying a robot means risk is automatically handled. In reality, risk controls are configuration choices, not default guarantees.

If you’re setting up an automated strategy, you should consider:

Position sizing: Will the bot trade fixed lot sizes, scale with equity, or risk a percentage per trade? Each approach has consequences for drawdown behavior.

Stop-loss and take-profit behavior: Is the stop always placed? Does it trail? How does it react if the broker requires specific stop distances or if spreads widen?

Order type selection: Market orders can suffer from slippage when volatility spikes. Limit orders may miss the move entirely. The bot needs to be designed around your broker’s execution reality.

Maximum exposure rules: Can it open multiple positions at once? If yes, do those positions collectively exceed your risk tolerance?

Daily or weekly loss limits: A sensible “kill switch” can stop the bot after a drawdown level is hit, preventing one bad week from turning into a bad month.

Even when a strategy is profitable in backtests, risk management is what determines whether you can survive long enough to let the edge play out.

Backtesting: what traders often do wrong

Backtesting sounds straightforward, but it’s the method, not the label, that determines whether results are trustworthy.

1) Using the wrong assumptions
Many backtests assume perfect fills. In real trading, you get spreads, slippage, and execution delays. If your live environment differs from backtest assumptions, results may be exaggerated.

2) Using only one market condition
A strategy tested only on trending years might fail in ranging markets. A strategy tested on volatile periods might underperform when volatility drops.

3) Not validating on unseen data
Ideally, you test a strategy on one dataset, tune parameters, then evaluate on a separate dataset you did not use for tuning. Without this, you’re more likely to be fooled by overfitting.

4) Ignoring costs
Commissions, swaps (overnight financing), and spread changes matter. A strategy that barely beats after costs in backtest might disappear in live trading.

To be fair: backtesting platforms have improved a lot, but results still require sanity checks.

Choosing a trading bot: what to look for

If you’re looking at existing automated systems (rather than building your own), you’ll see marketing claims: high win rates, steady returns, and sometimes suspiciously perfect charts. The trick is to evaluate whether the performance claim is based on something credible and repeatable.

Here are practical criteria worth considering:

Transparency of rules: Can you see the entry and exit logic, risk settings, and how it handles different market conditions?

Risk limits and drawdown control: A bot that can trade unlimited exposure is not “aggressive,” it’s just reckless in robot form.

Backtest methodology: Does it account for spreads and slippage? Does it show results across different time periods?

Update and support: Markets do not freeze. A bot that never changes might still run fine for a while, but it won’t last forever if its assumptions break.

Broker compatibility: Some bots assume a specific broker’s execution behavior or platform settings. A bot that works in one environment might misbehave in another.

If a bot can’t explain how it manages risk and execution, treat that as a red flag, not a mystery to solve. You don’t need to decode a black box to trade; you need rules you can test and control.

Technical and operational requirements you should plan for

Even if your strategy is strong, the “plumbing” can still wreck your day.

Platform and server stability: Running a bot on a personal computer can be risky. Your PC might reboot, sleep, or disconnect. Many traders use a VPS (virtual private server) for stability so the bot can run continuously.

Monitoring: “Automated” doesn’t mean “set and forget.” You want at least basic alerts: when the bot stops, when it fails to place orders, or when trading is paused due to risk limits.

Log review: Logs are where you confirm what the bot actually did. If your results differ from expectations, the logs help identify whether the issue was execution, condition logic, or a connectivity problem.

Version control for strategy changes: If you adjust parameters, you want to track those changes. Otherwise you’ll lose track of which version produced which result, and you’ll start making decisions based on vibes, which trading already punishes enough.

Common real-world scenarios (and how automation can help or hurt)

Scenario 1: Busy schedule, consistent session trading
A trader with a daytime job might want trades during London and overlap sessions but can’t watch the chart constantly. A bot can run during those windows with strict risk limits. The benefit is obvious: no missed signals due to being at work. The cost is also clear: if spread widens around certain events, the bot needs filters or it will keep trading through worse execution.

Scenario 2: Strategy depends on volatility regime
Some strategies perform well in expanding volatility, then break when volatility compresses. Automation can adjust parameters if designed to do so—like tightening or widening stops based on volatility measures. Without those adjustments, a bot may keep trading happily after the regime shifts.

Scenario 3: Surprise news event
If a major economic release hits, Forex can whip around quickly. Humans sometimes pause trading manually. A bot might continue placing orders if its conditions are met. That can either be fine (if the bot is designed for it) or disastrous (if it isn’t). A practical safeguard is pausing during a time window around high-impact releases.

Scenario 4: Backtest looked perfect, live didn’t
This is the classic story. The strategy “worked” historically with low drawdown and consistent gains. Then live results show larger losses, missed entries, or reduced win rate. Usually, the cause is overfitting, incorrect fill assumptions, or changes in spreads and liquidity. Sometimes the strategy simply outlived its usefulness.

When automated Forex trading makes the most sense

Automated trading tends to fit best when you have:

– A strategy with clear, testable logic
– Rules that remain valid across reasonable market variation
– Risk controls you trust more than your emotions at 2 a.m.
– A plan for monitoring and adjustments when behavior changes

It’s also easier to succeed with automation when your strategy is not overly dependent on subjective interpretation. If the strategy requires “feels like trend strength,” a bot won’t get much value from that. If the strategy relies on measurable conditions, automation can do its job.

When you should be cautious (or maybe skip the bot)

It’s wise to be cautious if:

– The strategy depends on inconsistent data or unclear indicators
– You’re buying a bot with vague rules and impressive marketing
– Risk settings are unclear or missing
– The system trades many positions with weak exposure limits
– You can’t spend time reviewing performance and logs

A robot is not a shortcut around learning. It’s a mechanism for executing logic. If you don’t understand the logic and risk behavior, you’re basically investing in automation without ownership of the process.

Conclusion

Automated Forex trading brings real benefits, especially speed and consistency. It can cut down emotional decision-making, trade around the clock, and help you evaluate strategies through backtesting before you risk live money. When implemented properly, automation can make execution more disciplined and predictable, which is honestly more valuable than people realize at first.

At the same time, the downsides are just as real. The system can suffer from technical failures. Over-optimization can make performance look great in tests while falling apart in live markets. Setup and ongoing maintenance costs add up, and the absence of human judgment means a bot might keep following rules during news spikes or changing market regimes.

So the practical goal for traders isn’t to treat automation like a replacement for thinking. It’s to treat it like a tool: one you understand, test, monitor, and deploy with controlled risk. If you do that, automated systems can complement your trading approach in a way that feels less like gambling and more like operating a process—boring, yes, but usually profitable when done right.

For further insights and resources on Forex trading, visit Forex Factory, a platform offering a wealth of information and tools for traders at various levels of proficiency.

How to Use Volume in Forex Trading

How to Use Volume in Forex Trading

Understanding Volume in Forex Trading

Forex traders talk about “volume” the way stock traders talk about it—like it’s an obvious, measurable thing. In stocks, volume often means the number of shares traded during a given time window, usually coming from a central exchange. In forex, it’s more complicated. There isn’t one central marketplace where all orders meet, so “real” exchange-traded volume data usually isn’t available. What you do get instead is a proxy for participation and activity, and that proxy is still useful when you know what it is (and what it isn’t).

At a practical level, volume in forex helps you answer questions like: Is this move being backed by real participation, or is it just price drifting? Are traders piling in on a breakout, or is the breakout likely to fizzle out? Does momentum look healthy, or does it look thin? Even with imperfect data, traders consistently use volume readings to improve entries, exits, and risk management.

What Traders Mean by Volume in Forex

In forex, volume generally refers to how many trades or price changes are occurring in a chosen time period. Since there’s no single centralized venue, brokers and platforms build volume metrics from their own order flow and execution feeds. That means the exact volume number you see depends on the data source behind your platform.

That said, the concept stays the same for most tools: volume is a measure of activity. Higher activity often means stronger consensus, tighter spreads, and more participation around the current price. Lower activity can mean less buy/sell conviction, wider spreads, and more “thin” trading where price can move without much resistance.

A simple way to think about it: in forex, volume is less about “how many lots exactly changed hands” and more about “how intensely the market is reacting right now.”

Why Volume Data Is Messy (and Still Worth Using)

If you’ve ever stared at charts wondering why your “volume” looks different from a friend’s chart, you’re not imagining things. The main reason is that forex is decentralized. Orders are routed through a network of brokers and liquidity providers rather than one exchange. Since the market doesn’t publish a single master trade count for your pair, most public-facing “volume” is not the same thing as stock market volume.

But don’t throw the whole idea out. Traders aren’t using volume to prove a mathematical truth about the market. They’re using it to spot patterns: shifts in participation, surges during breakouts, and fading momentum after a push.

The trick is to treat forex volume as a behavioral indicator—something you interpret in relation to price action, trend structure, and time of day—rather than as a definitive measure of “real” turnover.

The Role of Volume Indicators

Volume indicators are tools built to show how activity changes as price changes. They don’t “predict” in a vacuum, but they help you judge whether the market is moving with conviction or with noise.

Most volume indicators fall into a couple of categories:
1) raw activity proxies (like tick volume), and
2) derived indicators (like OBV) that try to connect activity to price direction.

Let’s break down the ones you’ll see most often in forex.

Common Forex Volume Proxies and Indicators

Tick Volume

1. Tick Volume: In forex, true volume figures are not available. To circumvent this, platforms use tick volume, which denotes the number of price changes during a specified period. Traders often operate on the presumption that an uptick in tick volume signals increased trading activity, reflecting a stronger market consensus.

Tick volume counts changes in the price feed (ticks), not the number of lots traded across an exchange. That distinction matters. Still, tick volume correlates with activity fairly well, especially during major session overlaps (London and New York, for example).

How traders use it in real life:
– When price breaks above resistance and tick volume rises, traders read it as stronger participation behind the move.
– When price pushes and tick volume doesn’t rise, traders become more skeptical. Thin moves happen, and they can reverse just as quickly.

It’s not magic. But it’s often enough to improve your read on “is this move real?”

On-Balance Volume (OBV)

2. On-Balance Volume (OBV): This tool uses the concept of volume flow to anticipate changes in asset prices. By adding volumes on upward market days and subtracting them on downward days, OBV suggests that shifts in market volume often precede price movements. Large changes in the OBV line can hint at upcoming changes in price trends.

OBV is built on a simple idea: if price rises while volume expands, the buying pressure looks more convincing. If price rises but volume doesn’t confirm, OBV may lag. When OBV starts making higher swings while price stagnates, traders often anticipate a price move toward the direction of OBV.

In forex, OBV is usually computed using tick volume. So again, it’s a proxy. But the relationship between OBV slope and price behavior can still be useful.

A common way traders interpret OBV:
– OBV trending up with price: momentum is likely supported.
– OBV flat while price trends: momentum may be drying up.
– OBV diverging from price: a reversal or correction may be forming.

No single indicator should be worshipped on a pedestal. But OBV plus good chart structure can keep you from chasing weak moves.

Volume as a Market Participation Signal

Volume isn’t only about direction. It’s also about intensity. A strong move typically has:
– recognizable price structure (support/resistance, trend, or breakout level),
– improving volume readings as price commits,
– and reduced volume during consolidation (depending on the strategy and timeframe).

A weak move often has:
– price breaking levels without follow-through,
– volume dropping as price continues (which can mean the move lacks new buyers/sellers),
– or sharp volume spikes that immediately reverse (often signaling distribution or a stop-run).

This is where volume becomes more than an indicator. It becomes an evaluation tool: “How crowded is this idea right now?”

Utilizing Volume for Trend Confirmation

Volume plays a critical role in confirming trends and validating breakout movements in forex trading. When a currency pair decisively moves through established support or resistance levels, increased volume can signal the sustainability of the breakout. Conversely, breakouts occurring on low volume may warn traders of a false breakout, critical insight for making informed trading decisions.

That’s the headline version. Here’s the more useful, trader-friendly version: volume confirmation is strongest when it happens at the moment of decision—the candle or candles where price actually commits beyond the level—not just when price eventually moves away.

For example, if EUR/USD breaks above a resistance level by a tiny amount on low tick volume, then later moves higher slowly, you may still be dealing with a questionable breakout. But if you saw a noticeable volume expansion as that resistance was reclaimed, the odds shift in favor of continuation (all else equal).

What “Good Confirmation” Usually Looks Like

While no two trades are the same, volume confirmation often resembles this pattern:

– Breakout candle(s): price closes beyond the level, and volume is above the recent average.
– Retest phase: volume may cool off, but you often don’t see the same volume “panic” that accompanies failed breakouts.
– Continuation: volume tends to reappear when price re-accelerates, not only at the first break.

If you’re a “chart cleaner,” this can feel tedious. But it’s a straightforward check that can prevent you from trading every scarecrow breakout you see in the wild.

Volume and False Breakouts

False breakouts are common in forex because markets spend a lot of time probing levels, especially during slower hours. Volume helps you detect when probing turns into commitment—or doesn’t.

Low-volume breakouts often fail because there isn’t enough participation to hold the new price area. The first wave of buyers/sellers may run out, and price falls back into the prior range.

In practical terms, traders often look for:
– a breakout without volume expansion,
– followed by a quick return back into the range,
– sometimes with volume increasing on the rejection candle.

That last part is worth noting: rejection candles can show who was really in control.

Integrating Volume with Price Analysis

Volume indicators are most helpful when paired with price analysis. If you only look at volume, you lose context. If you only look at price, you might miss how “real” the move is. Combining both gives you a sturdier decision process.

Let’s go through a couple of common pairings traders use.

Volume and Moving Averages

Volume and Moving Averages: Observing a currency pair that concurrently experiences a price rise and increased volume while surpassing a moving average often signals a strong upward trend. Conversely, if prices decline with rising volume and fall below a moving average, it suggests bearish sentiments within the market.

Moving averages help you frame “trend vs. range,” while volume helps you evaluate whether the trend is being accepted by the market.

A practical example:
– Price closes above a moving average (say the 50-period) and volume rises at the same time.
– That combination often means the market is more than just bumping the average; it’s adopting the new direction.

On the flip side:
– If price crosses below a moving average but volume doesn’t confirm, it can turn into a stop-hunt scenario and price may reclaim the level.

This isn’t a guarantee. But it’s a better filter than a moving average alone.

Volume and Candlestick Patterns

Volume and Candlestick Patterns: Volume indicators can confirm recognized candlestick patterns. For instance, in a bullish engulfing pattern, the presence of high volume when the second candle forms reinforces the potential for a trend reversal, giving traders greater confidence in acting on this signal.

Candlestick patterns tell you about price behavior within a time window. Volume tells you about participation around that behavior. When they align, the signal often becomes cleaner.

Common confirmations:
– Bullish engulfing with higher volume: more convincing reversal potential.
– Bearish engulfing with higher volume: more convincing reversal potential to the downside.
– Breakout candles with strong volume: more convincing commitment.

But remember: candlestick patterns are already somewhat noisy on lower timeframes. Volume confirmation makes them less noisy, not noise-free.

Volume and Divergence (When Price and Volume Disagree)

One of the more interesting ways traders use volume is divergence—when price makes a move but volume indicators suggest the move lacks support.

You’ll often see divergence when:
– price makes a new high, but OBV (or another volume measure) fails to make a similar high,
– or price makes a new low, but volume indicator fails to confirm.

Divergence doesn’t automatically mean a reversal is guaranteed. Sometimes it means price is simply pausing or restarting. Still, it’s a useful warning sign when it shows up near major support/resistance.

A quick reality check: divergences are easier to spot on higher timeframes, where the noise level drops. On very low timeframes, divergences can appear constantly just because tick volume is jumpy.

Volume-Based Trading Tactics Traders Actually Use

Volume analysis can power different styles, depending on what you trade and your timeframe. Here are a few tactics you’ll recognize, described in plain terms rather than trading-bro poetry.

1) Breakout Confirmation Filter

Instead of trading every breakout, you require volume confirmation on the breakout candle.

How it tends to be applied:
– Identify a clear level (range high, previous swing high, or support).
– Wait for a close beyond the level.
– Check whether volume is above the recent baseline (not necessarily “the highest candle ever,” just meaningfully higher than the average for that phase).
– If it isn’t, you either skip or reduce size.

This helps when a lot of traders are watching the same chart level; if nobody is really participating, the breakout is often just a tap, not a takeover.

2) Reversal Checks After Exhaustion

Some traders combine volume with reversal structures. For example, after a strong run up:
– You watch for a candle sequence that suggests exhaustion (long wicks, rejection, engulfing, or a sharp close back inside a level).
– If that reversal candle also shows a volume spike, it suggests traders are aggressively taking the other side.

This is not just about “price went down.” It’s about whether the move down came with enough activity to matter.

3) Managing Trades with Volume Shifts

Volume can also help with trade management. Even if your entry is decent, you still need an exit plan.

Common management cues:
– If price continues in your favor but volume steadily drops, you might tighten risk or plan for a partial exit (depending on your strategy).
– If price goes your way and volume expands, that supports continuation; you might give the trade a bit more room.

The point is not to micromanage every bar. It’s to avoid being stubborn when the market’s participation starts to fade.

Strategic Considerations

Traders should approach the use of volume with a strategic mindset. While volume is a potent tool, it should not be the sole basis for trading decisions. It’s vital to consider the broader market context, incorporating diverse data sources and analytical techniques. This multilayered approach helps prevent misinterpretations that can arise from relying on volume data alone.

Educational resources, such as Investopedia, offer valuable insights into technical analysis methods, broadening one’s trading toolkit.

Since volume is a proxy in forex, context is where your analysis becomes reliable.

Time of Day Matters More Than People Admit

Forex isn’t traded equally at all hours. During major sessions, tick volume tends to be higher and moves tend to have more follow-through. During thin hours, you can see “volume-like” spikes that don’t represent strong conviction—sometimes it’s just a couple of large orders traveling through liquidity pockets.

So if you’re analyzing volume:
– compare volume to what’s normal for that session,
– and avoid anchoring your interpretation just because you saw a big tick volume bar at 2 a.m.

Yes, it’s boring. Yes, it matters.

Volatility and News Impacts

Volume spikes often coincide with scheduled economic releases (CPI, NFP, central bank statements) and unscheduled news. After news hits, volume can drop quickly even if price keeps moving, or volume can remain elevated during a longer repricing.

If you treat every volume spike as “smart money” you’ll get fooled. Sometimes news causes a burst of activity and then the market decides a calmer direction.

A more grounded approach:
– note whether the volume spike happened at the start of a sustained move or just during the initial reaction,
– check whether subsequent candles show follow-through or a snapback.

Broker and Platform Data Differences

Because forex doesn’t offer a universal total volume feed, different brokers (and different chart feeds within the same broker) may show slightly different “volume” behavior. OBV and tick volume indicators might still trend similarly, but exact levels and candle-by-candle comparisons might not match.

If you’re using volume indicators:
– stick to one data source for consistency,
– and avoid switching platforms mid-strategy unless you’re willing to re-test.

Volume in forex is like a watch: the concept is there, but the readings depend on the manufacturer.

Backtesting and Paper Trading: Do the Unsexy Work

Volume-based entries can look impressive in hindsight and disappointing in real time, mainly because traders change their interpretation after they see the outcome. That’s why backtesting matters.

If your plan is:
– “I only enter breakouts when tick volume is above average”
then you should backtest:
– what timeframes you trade,
– what duration your “average” volume uses,
– and whether your results hold during high-news periods.

You don’t need fancy machine learning or a lab coat. Just consistent testing so your brain doesn’t rewrite the rules after a loss.

Common Mistakes When Using Volume in Forex

Even experienced traders occasionally misuse volume metrics. Here are a few errors that show up again and again.

1) Treating tick volume as real traded volume

Tick volume is a count of price changes on your feed. It’s still valuable, but it’s not proof of how many lots traded across the entire market.

2) Ignoring location on the chart

Volume tells you about activity, but it doesn’t tell you whether the activity happened at an important level. A volume spike in the middle of nowhere can mean almost nothing.

3) Chasing after the volume spike

A common problem: price breaks, volume spikes, and then by the time you react, the burst is already fading. If your strategy uses volume, define whether you enter on the breakout candle, after confirmation, or on retest.

4) Overusing volume as a “pass/fail” rule

Volume can support decisions, but strict filters can cause missed opportunities. If your rule is too rigid, you’ll skip good trades and end up trading mostly “safe” setups that might not be the best ones.

Volume and Fundamentals: When the Macro Shows Up

Fundamental drivers can strongly affect volume behavior. For example:
– a currency pair may trend because of interest rate expectations and positioning,
– and volume may rise because traders are adjusting net exposures.

On the other hand, technical setups can still play out even when news is the main driver, especially when the market starts respecting levels after the initial repricing.

So, in practice:
– use fundamentals to understand why the market might act with intensity,
– use volume to gauge whether the intensity is turning into follow-through or fading.

You don’t need a spreadsheet the size of a phone directory, but you do need at least basic awareness of upcoming events if you’re trading news-sensitive pairs.

Practical Workflow: How a Trader Might Use Volume

Here’s a realistic, repeatable workflow that doesn’t depend on fancy gadgets.

1. Mark the levels that matter: recent swing highs/lows, consolidation boundaries, and nearby moving averages.
2. Wait for price to approach and react.
3. When price breaks or signals reversal, check the volume indicator:
– Did activity rise relative to the recent baseline?
– Is the signal happening where the market already “cares”?
4. Confirm with price behavior:
– close beyond the level for breakouts,
– rejection followed by follow-through for reversals.
5. Plan the trade:
– where the invalidation level sits,
– where you’ll take partial profits,
– and what volume behavior would warn you to exit early.

If you’ve ever managed a trade with no invalidation point, you know how that ends. Volume should help you define “what would convince me I’m wrong,” not just “what might be right.”

Bottom Line on Forex Volume

In conclusion, although forex trading does not offer a complete picture through volume analysis alone due to the absence of centralized data, when combined with other technical and fundamental analysis methods, it stands as a potent tool for developing more nuanced and effective trading strategies. Regular analysis, a commitment to continual learning, and a pragmatic approach to signal interpretation will empower traders to utilize volume data more successfully, enhancing their market engagement and trading outcomes.

The Impact of Government Policies on Forex Prices

The Impact of Government Policies on Forex Prices

The Effect of Monetary Policies

Government monetary policies are powerful tools that significantly influence foreign exchange (forex) prices. Among these tools, central banks, such as the Federal Reserve in the United States, frequently employ interest rate adjustments to steer economic activities in their desired direction. The actions of these institutions are pivotal in maintaining economic stability and influencing investor confidence.

Forex traders usually care about one question: what will happen to interest rates, inflation expectations, and the flow of money across borders? Monetary policy sits right in the middle of that. When markets believe a central bank will tighten or loosen policy, currency values react quickly—sometimes before any official decision is even announced. That’s because FX markets price expectations, not press releases.

This “expectations-first” behavior matters in real life. Imagine a trader who follows central bank communications, not just rate changes. If the central bank signals a higher path for rates over the next year, traders may bid up the currency in advance, even if the current meeting ends with no change. Conversely, if the central bank shifts its tone toward easier policy, the currency can weaken quickly as capital flows adjust.

Interest Rate Adjustments and Capital Flows

When a central bank raises interest rates, it usually attracts foreign capital investors seeking higher returns on their investments. This influx of foreign capital leads to an increase in the demand for that country’s currency, ultimately resulting in the strengthening of the currency’s value within the forex market. In contrast, when a central bank opts to lower interest rates, it can cause a depreciation of the national currency, as the lower rates tend to deter foreign investment, reducing demand for the currency.

There’s a practical way to think about this: currencies often behave like “interest-rate trades.” If one country offers higher yields with stable or improving growth prospects, global investors tend to move capital there. It’s not only banks and hedge funds, either. Pension funds, insurance firms, and multinational corporations that manage cash and hedging exposures also respond to yield differences.

Still, the relationship isn’t always a clean one-to-one mapping. Interest rate hikes can strengthen a currency, but only if markets believe the move is credible and sustainable. If people expect hikes because the economy is in trouble (for example, trying to fight inflation that’s already high), the currency can weaken anyway if growth risks dominate.

Also, the effect depends on what the market expected. Suppose a central bank raises rates by 50 bps, but traders already expected 75 bps. The currency might still fall because the result is “less hawkish than priced.” FX is picky like that—nothing personal, just math.

Real Interest Rates, Inflation, and Risk Premiums

To understand currency reactions, it helps to go one layer deeper than the headline rate. What matters for capital flows is often the combination of:

  • Real interest rates (nominal rates adjusted for inflation expectations)
  • Inflation stability (and whether the central bank has credibility)
  • Country risk (political risk, banking risk, fiscal sustainability)
  • Liquidity (how easy it is for investors to enter and exit positions)

A currency can strengthen if real yields rise and investors feel confident that inflation won’t run away. On the other hand, if higher rates come with rising recession risk or fears of financial stress, the “risk premium” investors demand can offset some of the yield appeal.

So the FX response to rate hikes is often a tug-of-war: yield attraction versus risk fear.

Forward Guidance and Market Expectations

Central banks don’t only change rates; they also provide guidance about the likely path of policy. That’s where a lot of FX price action comes from. Forward guidance can reprice expectations for future rate differentials, which can shift currency values even if the current rate stays the same.

For example, if a central bank says it will keep rates higher for longer, it may raise expected future yields. That can strengthen the currency because investors adjust their expected returns. Alternatively, if guidance suggests policy will turn quickly, the currency may weaken due to reduced expected carry returns.

Traders watch for subtle wording differences. “Data-dependent” can signal caution, while “persistent tightening” can signal determination. Even if the exact meaning isn’t crystal clear, markets interpret it. They trade the interpretation.

Quantitative Easing

Quantitative easing (QE) is another monetary tool implemented by central banks to inject liquidity into the economy. This method involves the purchase of government securities or other financial assets from the market. By doing so, central banks aim to increase the money supply, lower interest rates, and encourage both consumer spending and business investment. Although QE can stimulate economic growth, it often carries a side effect of currency depreciation due to the expanded money supply. As the supply of money increases, the value of the currency tends to decrease, consequently impacting the exchange rate negatively.

Understanding the repercussions of QE on the forex market requires comprehensive analysis. While the immediate effect of increased liquidity is intended to be stimulative, the long-term impact can lead to concerns over inflation and reduced currency value. For traders and investors in the forex market, assessing the balance between these short-term benefits and long-term risks is critical.

QE affects FX through several channels, not just one:

  • Lower domestic yields: when central banks buy bonds, yields can fall, making the currency less attractive for yield-seeking investors.
  • Portfolio rebalancing: when central banks remove safe assets from the market, investors may search for return elsewhere, sometimes in foreign assets.
  • Inflation expectations: if QE raises concerns about future inflation, real yields may fall, pressuring the currency.
  • Liquidity and risk appetite: QE can improve financial conditions, which may increase risk-taking globally. That can either help or hurt depending on relative conditions across countries.

One reason QE can produce mixed results is that it often happens when the economy is under stress. If a central bank launches QE to prevent deflation, the currency might initially weaken, but if global markets decide the policy response reduces systemic risk, it might stabilize later. Again, the market is weighing different storylines at the same time.

Quantitative Tightening as a Mirror Image

It’s worth mentioning the opposite policy—quantitative tightening (QT), where central banks reduce asset holdings or let securities mature without reinvesting. QT can raise yields and tighten financial conditions. In many cases, that supports a currency, at least relative to countries still running QE.

QT isn’t always an “instant strength” event either. If QT signals that demand is weakening or recession risk is rising, the currency impact can be complicated. Forex often reacts more to the relative stance of policy and economic outlook than to the policy label itself.

Fiscal Policies and Forex Prices

Fiscal policies, which include government spending and taxation strategies, are integral to the movement of forex prices. Governments often employ fiscal policies not only to spur economic growth but also to stabilize economic conditions during periods of recession or economic downturns. A government that increases its spending without generating corresponding revenue through taxes may turn to borrowing methods, heightening inflationary pressures.

Where monetary policy affects currency through interest rates and inflation expectations, fiscal policy affects currency through the path of government debt, growth prospects, and credibility. Investors look at whether a country is building a sustainable future or stacking bills for later.

That “credibility” part is where sentiment becomes important. Two countries can run similar deficits, but if one has strong institutions and a credible medium-term plan, investors may treat the risk as manageable. If the other country appears politically unable to adjust spending or taxes, investors may demand a higher risk premium—often pulling money away from the currency.

Spending, Borrowing, and Inflation Risk

Alternatively, when investors observe such fiscal measures as being sustainable and growth-oriented, it can lead to currency appreciation as confidence in the nation’s economic stability increases. However, if fiscal policies are perceived as unsustainable, either due to excessive borrowing or unchecked spending, it could ensue in currency depreciation as confidence wanes.

Consider a simplified example. If a government increases infrastructure spending and also sets out a plan to fund it through tax reforms or spending cuts later, the market may expect medium-term growth and stability. In that scenario, the currency might hold up or strengthen. If spending rises while debt continues to climb with no off-ramp, investors may fear future inflation, higher interest rates, or debt monetization.

Debt monetization is a scary phrase for traders, even when it’s not happening. Markets worry about the possibility. If investors believe a government might eventually rely more on money creation to manage debt, currency confidence can degrade.

Budget Deficits and the Debt Maturity Profile

Forex traders don’t only care about how much debt exists, but also how it’s financed. A government with debt coming due soon may face more rollover risk, especially when global interest rates rise. That can influence currency perception because a sudden refinancing need can pressure local financial markets.

The maturity profile matters. If a country has long-duration debt and stable access to capital markets, its fiscal risks may look less immediate. If most debt is short-term and markets could tighten quickly, the currency can become more sensitive to risk-off periods.

Fiscal Multipliers and How Spend Actually Hits Growth

Not every dollar of spending boosts growth. The effect depends on the type of spending, the economy’s slack, and how quickly the government can deliver projects. In general, spending tends to raise growth more when the economy is below capacity and when supply constraints aren’t too severe.

Forex can respond to those expectations. If investors believe fiscal expansion will meaningfully improve growth and productivity, they may view the currency as supported. If they believe it will mainly increase deficits without improving economic output, the currency may face downward pressure.

Tax Policies

Tax policies, specifically changes in corporate taxes, can exert significant influence over exchange rates. For example, a reduction in corporate taxes can stimulate economic attractiveness by encouraging business investments and growth within the country. This, in turn, can have a favorable impact on the currency value as foreign investors seek to capitalize on the burgeoning opportunities. Conversely, increased taxation can stifle economic growth, business investments, and subsequently have an adverse effect on currency value by reducing its desirability among investors.

The complexity of tax policies extends beyond simple rate alterations. The effectiveness of these policies in influencing forex prices depends on the broader economic context, investor sentiment, and the domestic and international political climate.

Investors usually ask: will the tax changes be stable over time, or are they political promises that could flip after an election? Stability tends to attract long-term capital. Frequent policy reversals, even if they look favorable on paper, can reduce investor trust.

Tax policy can also affect inflation indirectly. For instance, tax changes that raise consumer prices can feed inflation expectations. If those expectations rise faster than wages, real income falls and demand can shift. In turn, central banks may respond with different rate paths, influencing the currency.

Trade Policies and Their Impact

Trade policies have far-reaching effects on a country’s forex market, impacting currency values through mechanisms such as tariffs and trade agreements. When a country imposes tariffs on imports, this can lead to a decrease in the competitiveness of foreign goods, thereby affecting trade balances. Reduced demand for foreign currencies, as a result of such tariffs, can potentially lead to an appreciation of the domestic currency.

But if trade policies were that simple, markets would be boring. In reality, tariffs can also raise input costs for domestic companies that rely on imported parts and materials. Higher costs can feed inflation, spark retaliation from trading partners, and reduce export demand. Those second-order effects can offset any benefit to the currency.

This is why FX reactions to trade policy headlines can be hard to predict without context: what’s the size of the trade exposure, how elastic are imports, and what happens to inflation and growth expectations?

Trade Agreements

Participation in international trade agreements can provide a boost to a nation’s economic opportunities and lead to currency appreciation. Trade agreements often result in increased export volumes and foreign investments. When a country is part of major trade pacts, it frequently benefits from diversified trade and investment opportunities that can stimulate economic growth, thereby bolstering the strength of its currency in the forex market.

The broader implications of these trade policies on forex prices are tied to how they influence the balance of trade over time. Assessment of a country’s participation in international trade, its commodity exports and imports, and broader economic policies is essential for understanding the potential currency impact resulting from varied trade policies.

In practice, trade agreements can also reduce uncertainty. Companies invest when they can plan shipments and pricing. That kind of predictability can support capital inflows, which may strengthen the currency.

There’s also the investment angle: if trade agreements open markets for foreign firms, those firms may put money into factories, logistics, and supply chains. Those investments usually come with currency-related flows—sometimes visible, sometimes hedged, but still influential.

Current Account Effects and Currency Value

A country’s trade balance matters because it feeds into the current account. If exports rise relative to imports, demand for the domestic currency can increase as foreign buyers pay for those goods. If imports rise faster than exports, the country might need to sell domestic currency to pay for foreign purchases.

Forex doesn’t trade “trade balance” directly; it trades how investors expect the current account, growth, and interest rate outlook to evolve. Still, persistent deficits can pressure a currency over time, especially if the financing comes from unstable flows.

A common real-world pattern: a country runs large deficits and funds them with short-term capital. When global risk sentiment shifts and investors reduce exposure to that country, the currency can weaken sharply. In contrast, if deficits are financed by long-term foreign direct investment, the currency might be more stable.

Regulatory Policies

Regulatory policies within financial markets, particularly in the forex market, are crafted to maintain the integrity and stability of currency values. Governments and financial regulatory bodies may implement various measures aimed at stabilizing currencies and preventing excessive volatility that could disrupt economic stability and investor confidence.

Regulation matters because forex is driven by trust. If investors believe markets are fair, liquidity is sufficient, and rules are enforced consistently, they’re more willing to participate. If regulation is unpredictable or enforcement is uneven, investors can stay away—or demand extra compensation for risk.

Market Interventions

One of the direct approaches is market interventions by central banks, where they may opt to buy or sell the domestic currency to achieve certain exchange rate targets. Such interventions are generally intended to provide short-term stability in the forex market, smoothing out abrupt fluctuations. However, it is crucial that these interventions align with underlying market fundamentals; otherwise, these efforts might not sustain long-term trends.

Intervention is often misunderstood as a “control the exchange rate” switch. In most cases, central banks can influence the price only to a point. If intervention runs against factors like interest rate differentials, inflation surprises, or weak fiscal credibility, markets may eventually overwhelm the central bank’s attempts.

That said, interventions can still be meaningful. They can reduce panic, buy time for policy makers, or discourage speculative overshooting. Traders watch for signals such as:

  • Changes in official reserve levels
  • Statements about policy intentions
  • Patterns in spot and forward market behavior

For investors, the practical question is whether the intervention is a one-off smoothing move or part of a broader strategy. A central bank using intervention without changing policy stances might calm the market briefly, but the currency could resume its trend later.

Capital Controls and FX Volatility

Regulatory policies sometimes extend beyond intervention into capital controls—rules that limit how easily investors can move money in and out of a country. These can affect forex demand and supply, often reducing volatility in the short term. But capital controls can also reduce liquidity, limit investment, and complicate hedging strategies.

Capital controls can be politically sensitive. If they are imposed suddenly, they can spook investors and raise risk premiums. If they are designed transparently and paired with credible monetary and fiscal policy, markets may adapt. Still, most investors prefer open markets; restrictions tend to come with a price.

Financial Regulation and Banking Stability

Forex markets are not separate from domestic financial stability. Banking rules, capital adequacy requirements, and supervision can affect money demand, credit growth, and investor confidence—indirectly shaping currency trends.

For example, if regulation strengthens bank balance sheets, reduces the risk of crises, and supports steady credit, investors may treat the currency as safer. If regulation is weak or inconsistent, the risk of funding stress can rise, and that can pressure the currency during global risk-off periods.

Putting It Together: How Policies Interact in Real Forex Trading

In the real world, these policies don’t arrive in neat boxes. Monetary policy, fiscal decisions, trade rules, and regulatory moves interact, and markets react to the combined picture. When you watch FX closely, you’ll notice that price action often tracks the “most dominant story” at the time.

Suppose a central bank signals higher rates (supportive for the currency), but at the same time the government expands spending without a credible funding plan (potentially bearish). Investors may then focus on which story seems more believable. If inflation rises and fiscal credibility declines, the currency may face pressure even if rates are theoretically supportive. If inflation stays controlled and financing looks manageable, the currency may strengthen.

Here’s a real-world style example. Imagine a country facing weaker exports due to tariff threats. Trade conditions worsen, which can reduce growth expectations and widen fiscal strain if revenues drop. The central bank may react with easier policy to support growth, which can weaken the currency. However, if the country also improves financial regulation and stabilizes banking funding, that can reduce stress and limit how far the currency falls. In other words, policy effects are not isolated—they stack.

A Quick Reference Table for Common Policy Signals

Policy Signal Typical FX Direction (Relative) What Traders Watch
Rate hikes or hawkish guidance Often strengthens currency Real yields, inflation credibility, market pricing of future moves
QE / bond purchases Often weakens currency Yield impact, inflation expectations, risk and investment flows
Higher deficits without credible funding Often weakens currency Debt sustainability, rollover risk, fiscal credibility
Growth-oriented fiscal plan with reforms Can support currency Policy durability, impact on productivity and inflation
Tariffs / trade barriers Mixed; depends on inflation and retaliation Trade balance effects, input costs, retaliation risk
Trade agreements Often supports currency Export growth, investment flows, uncertainty reduction
FX intervention to smooth moves Short-term stabilization possible Reserves, policy consistency, underlying fundamentals

How Traders and Investors Use This Information

The point of understanding policy effects isn’t to predict every tick of the market. It’s to form a better odds-based framework for decision-making. Traders build scenarios. Investors update portfolios. Both watch for changes in the policy mix.

In practice, many people approach forex with a simple method: identify the likely policy direction, compare it to peers, then track whether the market is pricing that path. If the market starts disagreeing with policy reality, currency moves can surprise to the upside or downside.

For example, when central banks shift their language, FX often moves first and asks questions later. That “move first” behavior is why traders monitor speeches, minutes, and press conference phrasing. It’s also why investors pay attention to debt auctions and fiscal announcements. Those events can change the narrative quickly.

And yes, it’s not only professionals. If you’re a business owner or a finance manager handling currency exposure, you probably care about practical timing. If you sell abroad, a strengthening currency can reduce your revenue in your home currency. If you buy imported supplies, a weakening currency can raise costs. Understanding policy signals can help you plan hedging and make operational decisions with less guesswork.

In summary, monetary, fiscal, trade, and regulatory policies move forex prices through interest rate expectations, inflation perceptions, growth outlook, capital flows, and risk premiums. The better you understand how these pieces interact, the less the market feels like it’s doing random stuff for fun.

In conclusion, understanding the complex interplay of monetary, fiscal, trade, and regulatory policies is vital for predicting and interpreting movements in the forex markets. For those interested in delving deeper into the intricacies of these policy impacts, resources from institutions like the International Monetary Fund can offer valuable insights into the strategies employed by governments and central banks worldwide. This knowledge is integral for grasping the broader economic landscape and effectively participating in forex trading and investment decision-making.