Understanding the Carry Trade Strategy in Forex
The carry trade strategy is one of those Forex ideas that shows up again and again, mostly because it sounds simple: borrow in a currency with a low interest rate, then invest in a currency with a higher interest rate. The difference between what you pay and what you earn does the heavy lifting. If exchange rates stay fairly calm, the “carry” can turn into a steady source of returns.
In practice, Forex is rarely calm for long. Carry trades tend to perform best when markets are in “risk-on” mode, and they can get rough when investors panic and unwind positions. Still, understanding how the strategy works—and what actually goes wrong—can help traders decide whether it belongs in their toolkit.
What “Carry” Means in Forex
Forex interest mechanics come from the interest rate environment set by central banks. When traders hold positions through the daily rollover (the broker’s adjustment often shown as swap or rollover), they effectively earn interest from one side of the currency pair and pay interest on the other.
So you’re not just betting on price direction. You’re also betting on two things:
1) The interest rate gap remains favorable (or at least doesn’t shrink).
2) The exchange rate doesn’t move against you enough to erase the interest advantage.
That second part is where things get spicy. A small favorable interest rate difference can be overwhelmed by an adverse move in the exchange rate.
How the Carry Trade Works
Forex is traded in currency pairs. Every currency in the pair has an associated interest rate expectation, shaped by central bank policy and market pricing. For carry traders, the core structure is straightforward:
– Borrow (sell) the low-interest currency
– Buy (go long) the higher-interest currency
– Collect returns from the interest differential, while hoping the price relationship doesn’t flip on you
The profit source is the interest rate differential, commonly called the carry. You can think of it like this: you’re collecting rent in the higher-yield currency and paying mortgage interest in the lower-yield currency. The rent helps, but if the exchange rate changes a lot, your “property value” in terms of the borrowed currency can drop.
Carry trades remain viable when the higher-yield currency stays stable versus the lower-yield currency or appreciates. When the higher-yield currency depreciates or the low-yield currency strengthens, the interest gain may not be enough to offset the loss from currency movement.
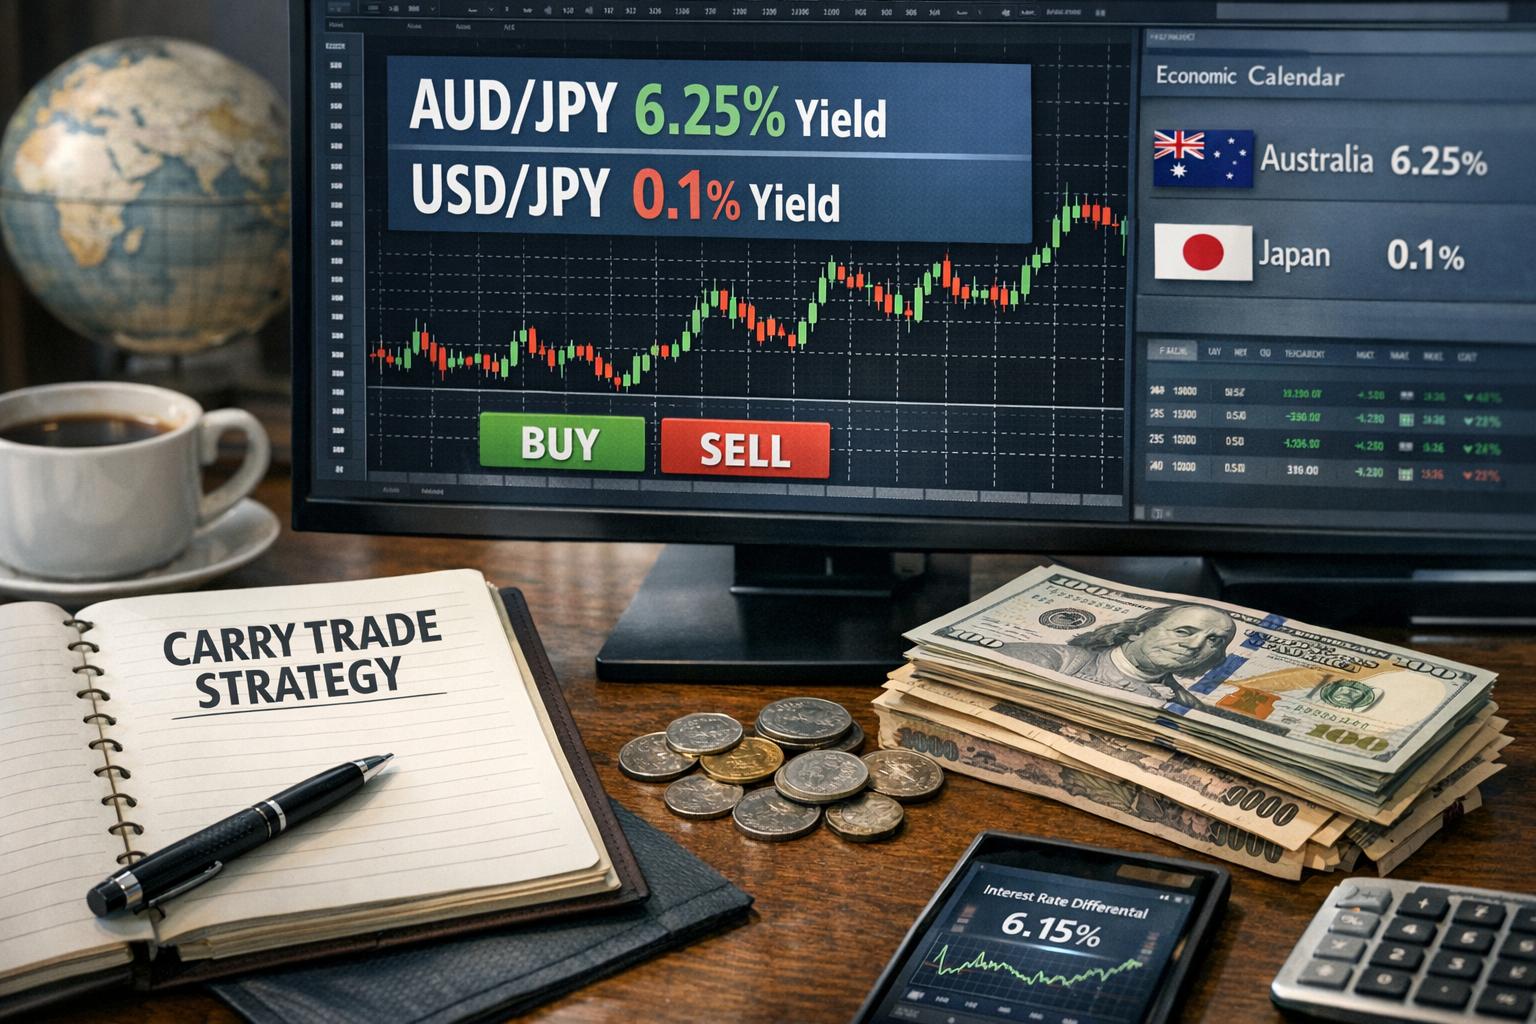
Example of a Carry Trade
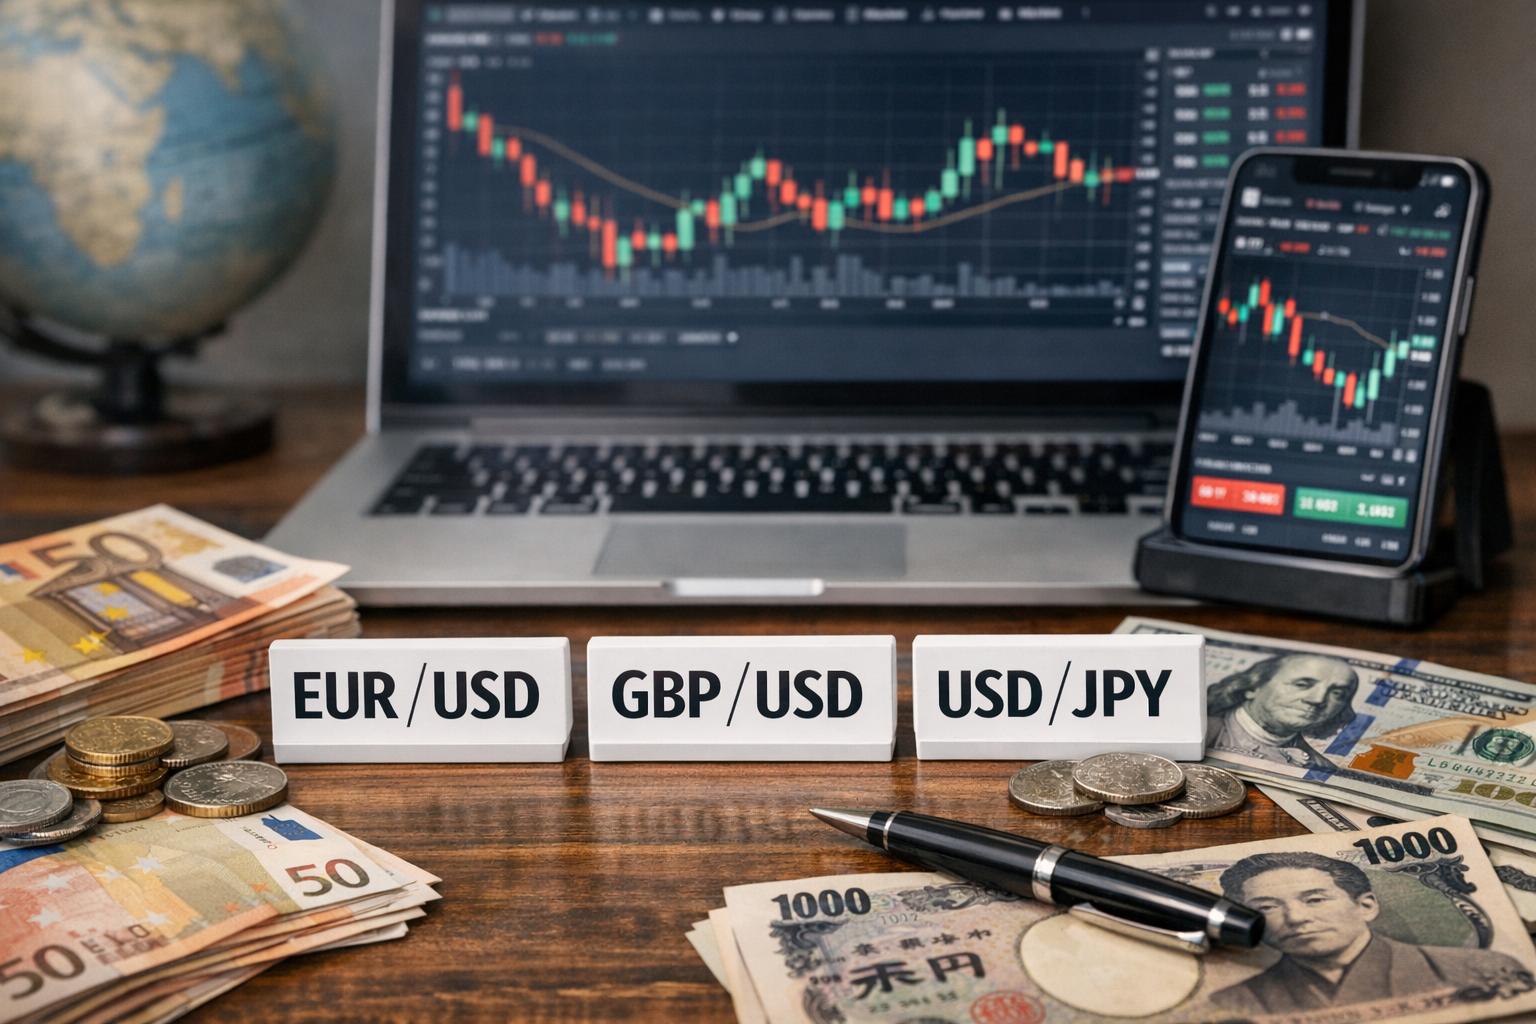
Consider a scenario where a trader chooses to borrow Japanese yen (JPY), attracted by Japan’s historically low interest rate environment. The trader then invests those funds into Australian dollars (AUD), often associated with higher interest rates relative to JPY.
In simplified terms:
– The trader sells JPY (borrows JPY / receives JPY proceeds)
– Converts into AUD (buys AUD)
– Holds the position to collect the interest differential reflected in swap/rollover
If AUD stays steady against JPY—or rises—the trader benefits both from the interest differential and from the currency price action. If AUD falls against JPY, it may cancel out the carry advantage. The outcome depends on which effect dominates: interest earned vs. exchange rate move.
Even When Rates Change, Carry Can Still Matter
A common misconception is that carry “only works” when interest rates stay exactly the same. In reality, carry trades often survive moderate changes, or they get adjusted when traders re-evaluate yield gaps.
Markets usually price interest rate expectations in advance. That means a carry trade might already embed optimism or fear before a central bank announcement lands. Traders must watch not only the current rate differential, but also what the market thinks will happen next—especially around:
– central bank meetings
– inflation reports
– economic growth data
– risk events that shift how investors value future returns
How Traders Choose Currency Pairs for Carry
Carry is still about interest differentials, but which pairs to trade introduces extra considerations.
Interest rate differentials (the obvious part)
The first filter is yield gap size. Larger differentials can create larger swap income. However, higher yield often comes with higher expectations of volatility and instability. Markets sometimes “overpay” for holding a currency because investors fear it might drop during stress.
Liquidity and spreads
Even strong interest advantages lose meaning if trading costs eat them alive. Carry trades typically involve holding positions for days to months. That means liquidity matters:
– Tight spreads reduce ongoing costs.
– Good execution reduces slippage risk.
– Reliable rollover rates reduce surprise.
In practice, traders often focus on widely traded pairs where spreads are manageable and liquidity is consistent.
Historical behavior during risk-off events
Some currencies act like stress sponges. During global risk aversion, funding currencies (the “borrow” side) may strengthen because investors flee to safety, while higher-yield currencies can weaken sharply.
A trader doesn’t need perfect foresight, but they do need pattern awareness. If a currency consistently drops during risk-off periods, that’s a warning label for carry.
Factors Influencing the Success of Carry Trades
Carry trades are often described as if they depend on a single lever—interest differential—then tossed into the market. The reality is more layered. These are the main drivers.
1) Interest Rate Differentials
The interest rate gap directly affects the rollover benefit. If the differential widens, carry can increase. If it narrows—due to rate hikes in the funding currency, rate cuts in the higher-yield currency, or changes in market expectations—the carry profit can shrink.
There’s also a timing layer. A central bank decision might not be the only factor. Traders usually react to:
– whether policymakers surprise the market
– the guidance language about future rates
– the pace of expected changes
Even if the decision is “as expected,” the market can still re-price future expectations.
2) Currency Valuation and Exchange Rate Direction
Interest income can look great on paper, right up until the exchange rate moves against you. For carry trades, the big enemy is relative currency strength.
– If the higher-yield currency depreciates versus the funding currency, your interest gains get dragged down.
– If the higher-yield currency appreciates, the carry effect works with price, not against it.
This is why carry performance often looks good when volatility is low and exchange rates are stable—and why it can turn into a loss when sudden moves occur.
3) Risk Sentiment
Carry trades tend to be popular when investors feel comfortable taking risk. When markets move toward risk-off, carry trades often get unwound quickly. Why? Because leveraged investors and systematic strategies may reduce exposure as currency volatility rises.
A sudden spike in volatility can trigger:
– margin pressure
– forced liquidation
– rapid position reduction
– broader “funding stress” dynamics
This is the part traders remember after a drawdown—carry can be profitable for a while, then exit in a hurry when the market decides it doesn’t like that trade anymore.
4) Leverage and Position Sizing
Many Forex traders use leverage. That can make carry income look impressive, particularly when the move is slow. But leverage also amplifies losses. A trade doesn’t need a catastrophic exchange rate move to hurt when leverage is high; it only needs enough movement to force margin issues or stop-loss triggers.
In carry strategies, position sizing and risk limits often matter as much as the chosen pair.
Risks Associated with Carry Trades
Carry trades offer a rational way to seek income, but they’re still speculative. The risks are not just theoretical; they’re the usual reasons real traders get burned.
Exchange rate risk (the big one)
The most direct risk is that the exchange rate moves against you. Even if you earn the carry each day, currency depreciation can offset those gains. In worse cases, the loss from the exchange rate move can exceed the interest you’ve collected.
This is why carry traders watch:
– long-run trends in the currencies involved
– relative economic expectations
– changes in central bank policy direction
– volatility forecasts and credit conditions
Leverage can magnify problems
If a carry trade includes leverage, then a move that would be manageable with a small position becomes painful. Leverage also affects how quickly you can react. If your margin level drops, you may have to exit at a bad price, not at a thoughtful time.
Macro events and central bank surprises
Carry trades are sensitive to macro news. Events that can change interest rate expectations, risk appetite, or currency sentiment include:
– unexpected central bank decisions
– sudden shifts in inflation or employment data
– major geopolitical events affecting risk and funding markets
– growth surprises that re-price expected policy paths
Sometimes the trade loses not because rates changed immediately, but because the market revised expectations.
Volatility spikes and “carry unwind” behavior
Even if your chosen pair remains reasonable under normal conditions, volatility can jump fast during market stress. Traders often unwind carry in waves. When many participants are on the same side of the trade, exits can become correlated and sharp.
This tends to show up when:
– there’s a sudden risk-off move
– spreads widen and liquidation accelerates
– momentum shifts away from high-yield currencies
Rollover and broker mechanics
Swap rates can vary by broker and account type. Some brokers may adjust swap calculations based on internal policy or market conditions. That can change the effective carry you receive.
Also, some carry trades depend on holding positions across rollovers. If you close before rollovers, you might not realize the interest advantage the way you expected.
Common Risk Management Practices
A carry trade without risk controls is like leaving the front door open and calling it “income.” Traders often use a combination of position controls and hedging tools.
Stop-loss orders and exit rules
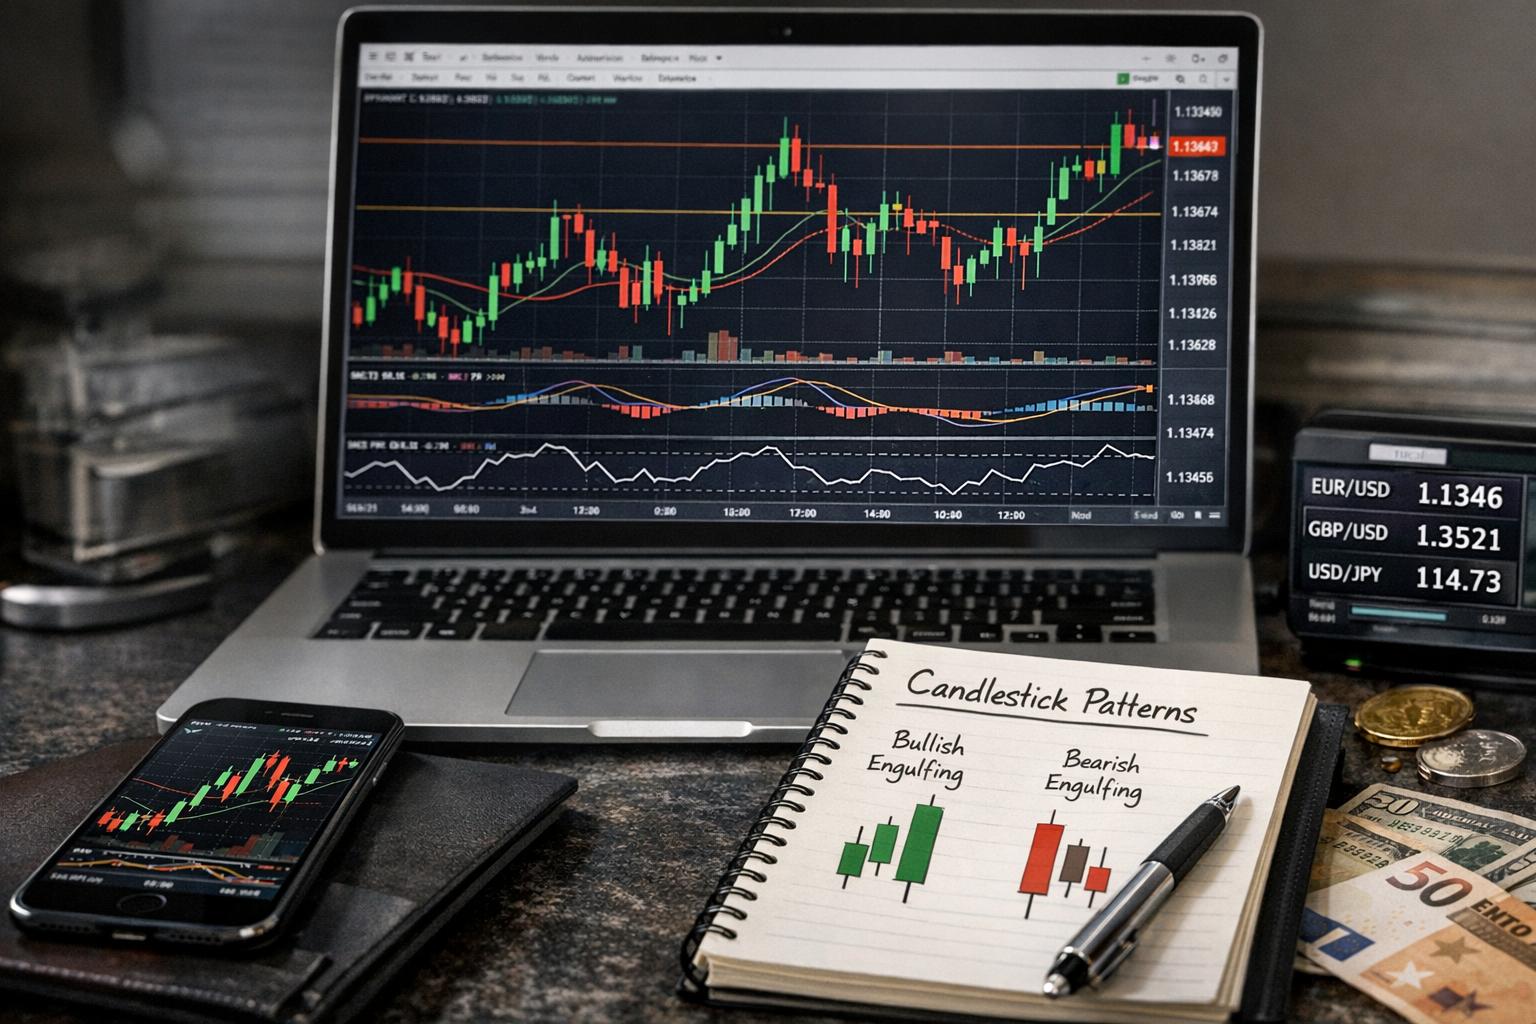
Stop-loss placement is tricky in carry trades because traders want room for normal noise. Too tight and you get stopped repeatedly; too wide and you risk larger drawdowns. Many traders use:
– technical levels (support/resistance)
– volatility-based distance
– rules tied to the thesis (for example, if the currency loses momentum beyond a threshold)
Regardless of the method, the point is to predefine what would make the trade thesis invalid.
Hedging with options (when feasible)
Some traders hedge carry trades using options. Options can help protect against large adverse moves, though they come with premium costs. Hedging is often more common for traders who:
– have the capital to pay option premiums
– can structure hedges efficiently
– trade in a way that still preserves expected carry after hedging costs
Reducing size during volatility increases
If implied volatility rises, carry trades often become less attractive because the chance of a sharp move increases. Traders may reduce exposure when:
– volatility spikes
– risk sentiment deteriorates
– major announcements approach
In practice, that means carry strategies are sometimes managed as “state-based” rather than “set-and-forget.”
Diversifying carry exposures
Instead of betting all capital on one currency pair, some traders spread risk across multiple pairs with similar characteristics. That can reduce the impact of a single currency’s idiosyncratic event.
Diversification doesn’t remove exchange rate risk, but it can reduce the chance that one shock wipes out the whole plan.
When Carry Trades Usually Perform Best
Carry is not a constant stream of wins. But it historically performs best under certain market conditions.
Stable or orderly markets
When volatility is low and investors are comfortable, funding markets run smoothly and high-yield currencies tend to hold value. In those environments, carry gains often show up more reliably.
Gradual interest rate shifts rather than sudden reversals
Carry thrives when interest rate expectations adjust slowly. If markets gradually re-price yields, the trade may still remain favorable even if not act exactly as first expected.
Risk sentiment stays “friendly”
In risk-on environments, traders can maintain leveraged positions longer. That keeps funding pressure low and reduces the likelihood of carry unwinds.
If you’ve ever watched a chart where a currency suddenly drops like it fell down a staircase, you already have the picture of what “unfriendly risk sentiment” looks like.
Real-World Use Cases (How People Actually Trade It)
Carry trades can appear in different styles depending on the trader’s timeline and constraints.
Short-to-medium horizon income attempts
Some traders use carry as a way to generate incremental returns while waiting for a modest currency move. Their focus is:
– selecting pairs with a healthy rate differential
– monitoring upcoming events
– keeping losses controlled
This doesn’t mean they ignore price. It means price is treated like a risk factor as much as a profit driver.
Longer-horizon positioning
Other traders treat carry as part of a broader macro view. They might hold positions because they believe central bank policy paths will remain favorable for the higher-yield currency. For longer horizons, risk management typically becomes more about:
– exposure sizing
– rolling strategies
– adapting when the market regime changes
Systematic or rule-based strategies
Some hedge funds and systematic strategies use carry because it can be measured and implemented consistently. These strategies might:
– choose currencies based on rate differentials and ranking models
– adjust exposure when volatility increases
– unwind positions according to risk signals and drawdown limits
The “system” doesn’t eliminate risk, but it changes how risk gets handled.
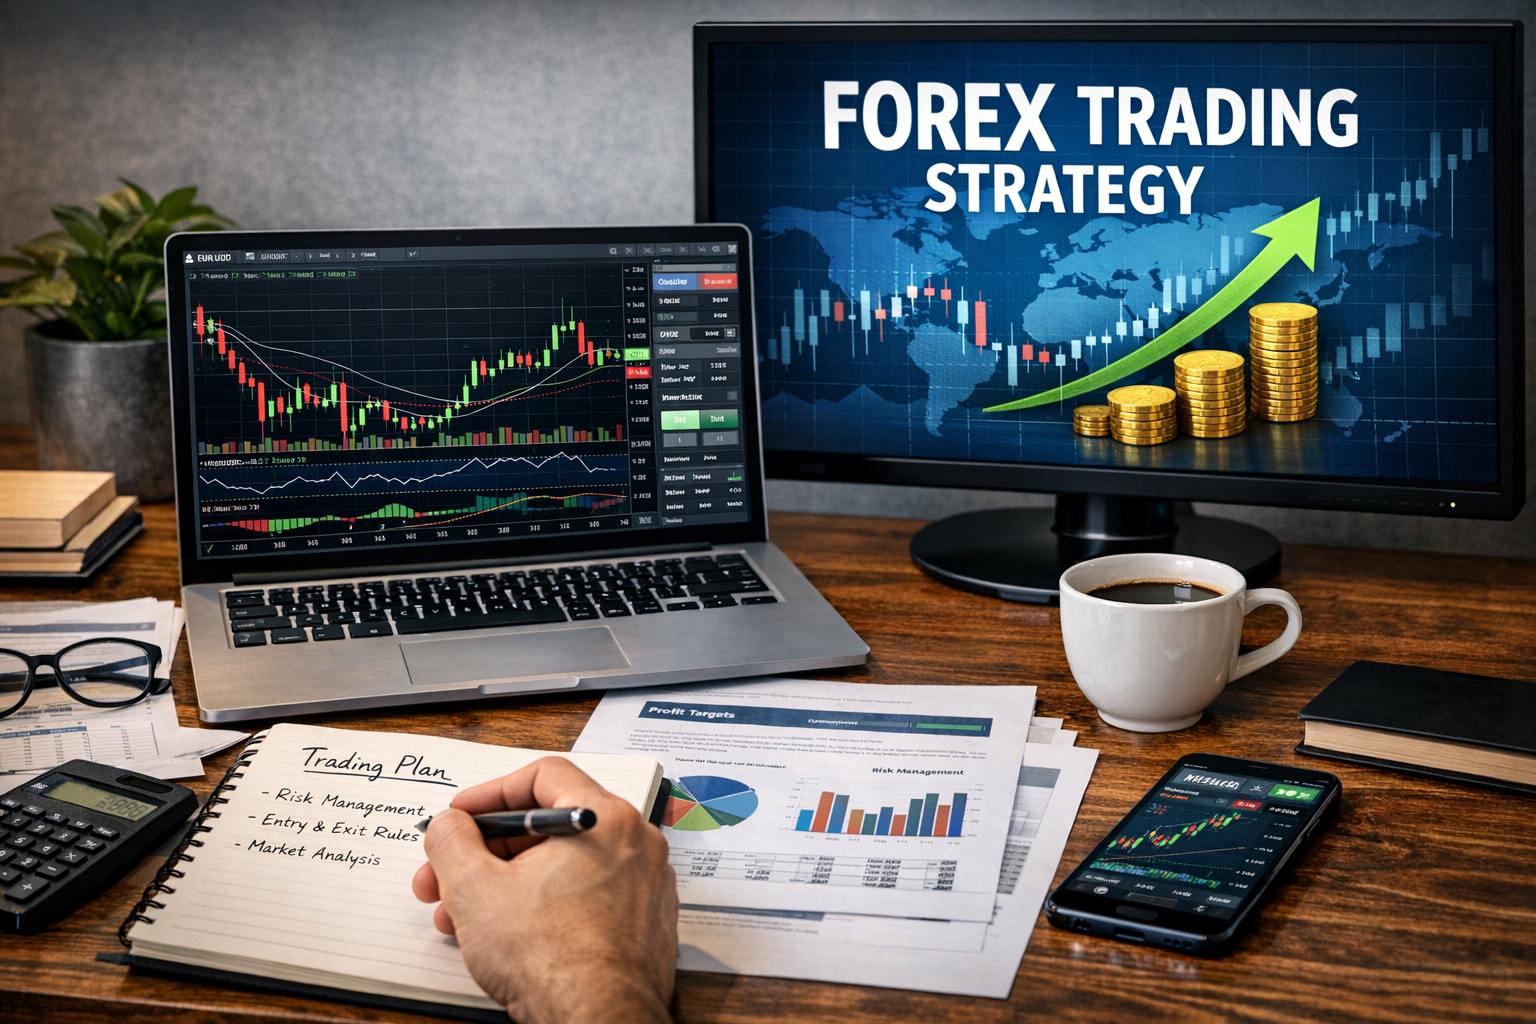
How to Evaluate a Carry Trade Before Entering
Before placing a carry trade, a sensible process looks less like a gut feeling and more like a checklist you actually follow.
Step 1: Confirm the expected interest differential
Don’t assume the highest yield today will stay the highest yield soon. Look at:
– current rates
– market expectations
– upcoming central bank schedules
Step 2: Check what would invalidate the thesis
Ask: what combination of exchange rate movement and policy shifts would make me stop being interested? If you can’t answer that, you’re trading blind. Carry trades are easy to start and hard to manage without an invalidation point.
Step 3: Measure risk relative to leverage
Even if you expect carry income, calculate how much movement would hurt the account given your leverage. This is where many traders discover that “small losses” aren’t necessarily small when leverage is high.
Step 4: Plan the exit, not just the entry
Decide how you will close:
– at a profit target
– when your thesis turns
– based on time (holding period)
– if a risk trigger happens (volatility or event risk)
A plan prevents emotional decision-making at the worst possible time, which is when the market starts doing the unexpected.
Does Carry Always Mean “Low Risk”? No.
Carry can mislead people. The trade often generates positive accrual (swap income), so traders assume the position has some built-in safety. It doesn’t.
Carry trades depend on a balance between:
– interest rate income and
– currency moves that can erase that income quickly
If you treat swap income as “free money,” you’ll eventually pay for the lesson. Markets don’t care about your schedule or your plan, only about price and risk.
Conclusion
The carry trade strategy in Forex works by exploiting the interest rate differential between two currencies—borrowing or selling the low-interest currency and investing in the higher-interest currency. It can generate returns through swap income, especially when exchange rates remain stable and risk sentiment stays supportive.
At the same time, carry trades are not risk-free. Exchange rate moves, leverage effects, central bank surprises, and sudden volatility spikes can lead to sharp drawdowns, particularly during risk-off periods. If you’re considering a carry trade approach, the smart move is to treat carry as a thesis you actively manage, not a passive income stream.
For additional education and market context, you can review resources such as Investopedia and DailyFX.